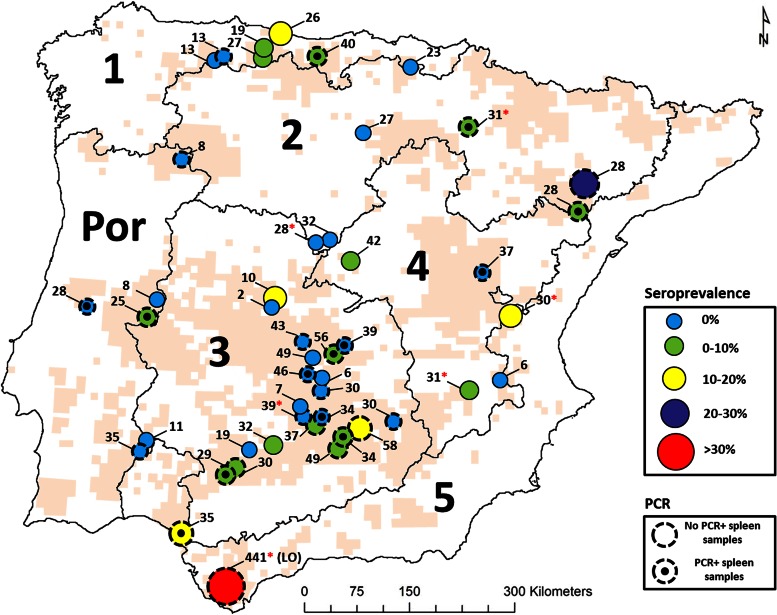
FIG 1.
Spatial distribution of Coxiella burnetii seroprevalence in Iberian red deer and presence of C. burnetii DNA in spleen samples. Each dot represents a surveyed red deer population. The current geographic distribution of the red deer in the Iberian Peninsula is shown in pale orange (54, 55). The number of sera analyzed per population is shown. A red asterisk next to the sampling size indicates red deer farms. The map of Spain has been divided into the bioregions established in the current Spanish wildlife disease surveillance program (27). Por, Portugal.

