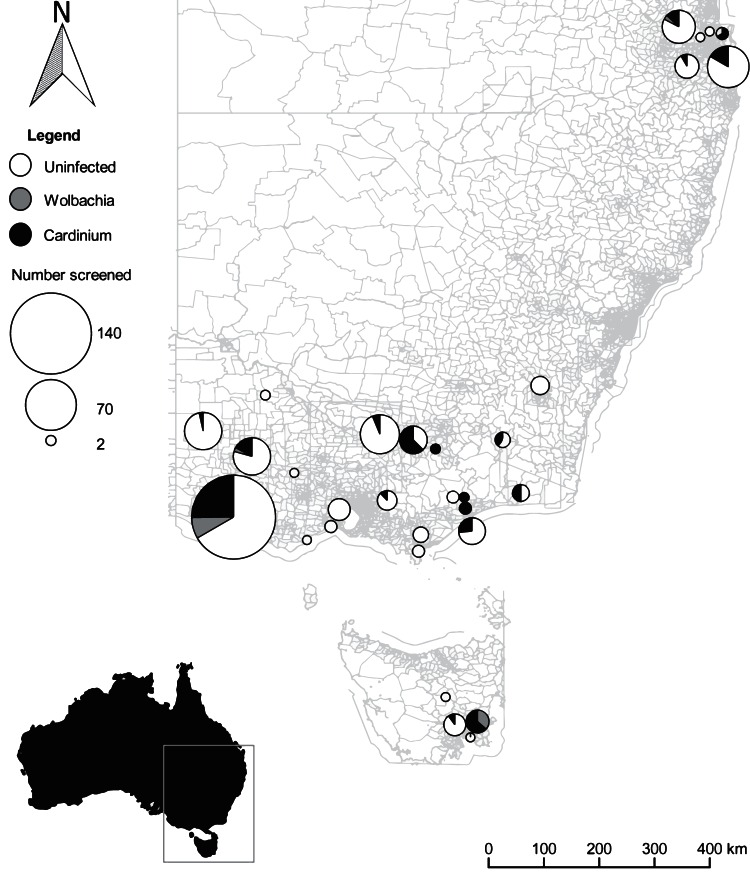
FIG 1.
Culicoides trapping and endosymbiont distribution. A map depicting collection sites across Queensland, New South Wales, Victoria, and Tasmania is shown (shapefiles were obtained from the Australian Bureau of Statistics, ASGC Digital Boundaries, Australia, July 2011; the distribution map was created in QGIS Wien v2.8.1 [44]). At all sites an equal number of Culicoides insects were screened with both the Cardinium and Wolbachia quantitative assays. The size of the pie chart represents the number of individuals screened, with the proportion of the Wolbachia (gray) or Cardinium (black) wedge representing the number of Culicoides insects which tested positive for each endosymbiont. White circles indicate Culicoides insects which were screened but in which no Wolbachia or Cardinium was detected.

