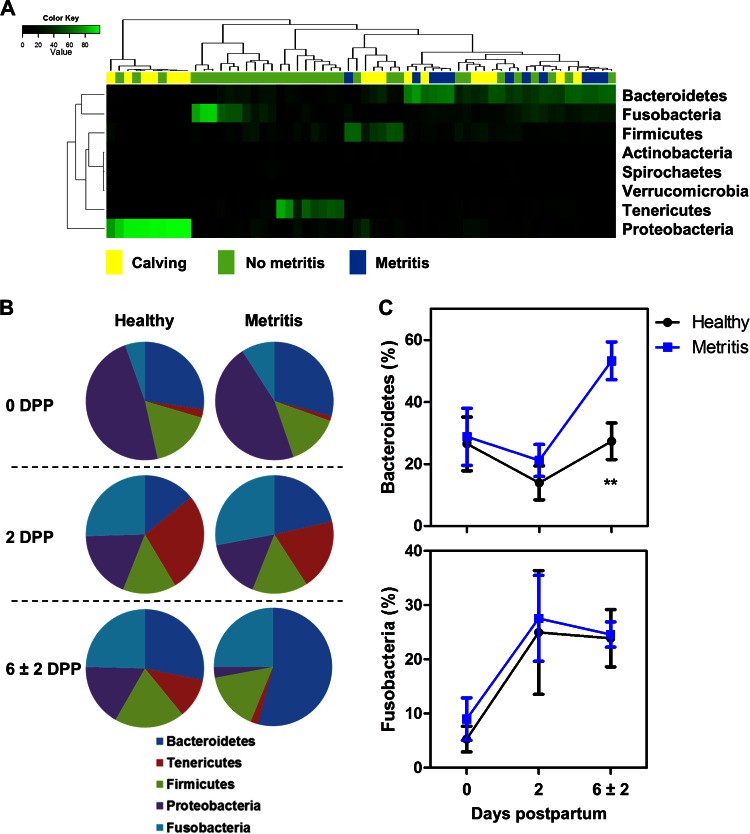
FIG 2.
Bacterial composition and abundance at phylum level. (A) Heat map analysis using the Euclidean distance. Columns represent 60 dairy cows, and rows represent the eight most abundant bacterial phyla. The color of each cell indicates the relative abundance of bacterial phyla. The heat map shows the shift of uterine microbiota from calving (Calving; 0 dpp) until establishment of metritis (Metritis) at 6 ± 2 dpp. “No metritis” shows samples from healthy and metritic cows at 2 dpp and healthy cows at 6 ± 2 dpp. (B) Distribution of the five most abundant phyla in healthy and metritic cows at 0, 2, and 6 ± 2 dpp. (C) Relative abundances of Bacteroidetes and Fusobacteria in healthy and metritic cows from 0 to 6 ± 2 dpp. **, significant difference between healthy and metritic cows at P < 0.01 using ANOVA.

