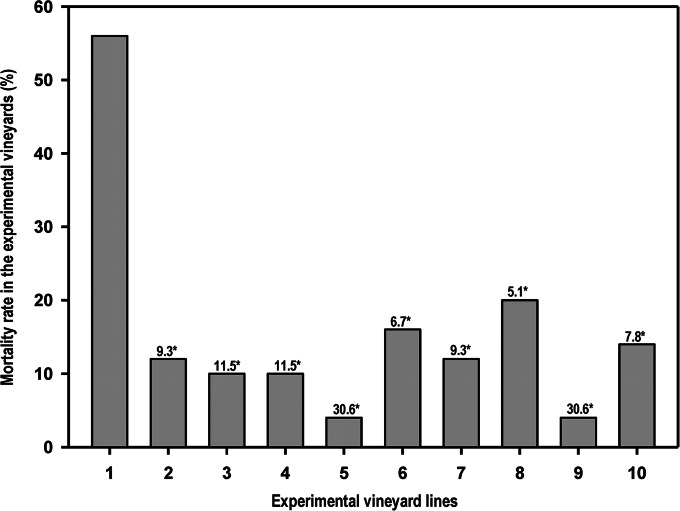
FIG 5.
Average mortality rate (%) of grapevine plants observed in the experimental vineyards after a hydric stress was produced by restricted watering. Line 1, plants infected on pruning wounds; lines 2 to 5, plants protected in pruning wounds with chitosan oligosaccharide, garlic extract, vanillin, and CGV mix, respectively; lines 6 to 9, plants infected on pruning wounds that have been previously protected by the application of chitosan, garlic extract, vanillin, and CGV mix, respectively; line 10, untreated and noninoculated control plants. Numbers marked with an asterisk represent the odds of plants in every line of surviving in comparison to the possibilities of survival for infected and nontreated plants from line 1 (P < 0.001, chi-square test).

