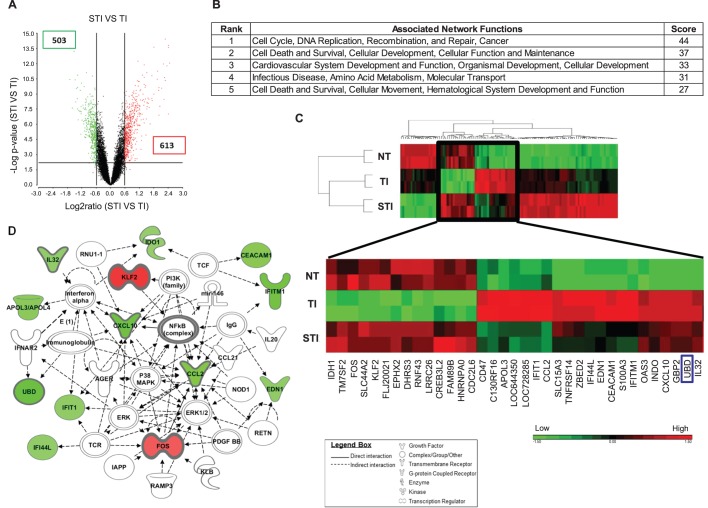
Fig. 2.
Differentially expressed genes and pathways deregulated in HCT116 cells treated with silibinin/TNF-α/IFN-γ (STI) compared to cells treated with TNF-α/IFN-γ (TI). (A) Volcano plot of expression profiles of genes deregulated in STI versus TI cells. (B) Table shows the top 5 networks of genes differentially expressed in STI versus TI cells. (C) Heat map of expression profiles of genes deregulated in STI versus TI treated cells. Subset of genes treated with STI that facilitate the reversion of expression profiles of cells from TI treated (TI) to untreated (NT) levels are magnified below the heat map. UBD gene (FAT10) is boxed in blue. Red indicates high expression; green indicates low expression. (D) Schematic diagram that shows the top ranked network (cell-to-cell signaling and interaction, cellular movement, connective tissue development and function) of this subset of genes that can revert TI to NT phenotype.

