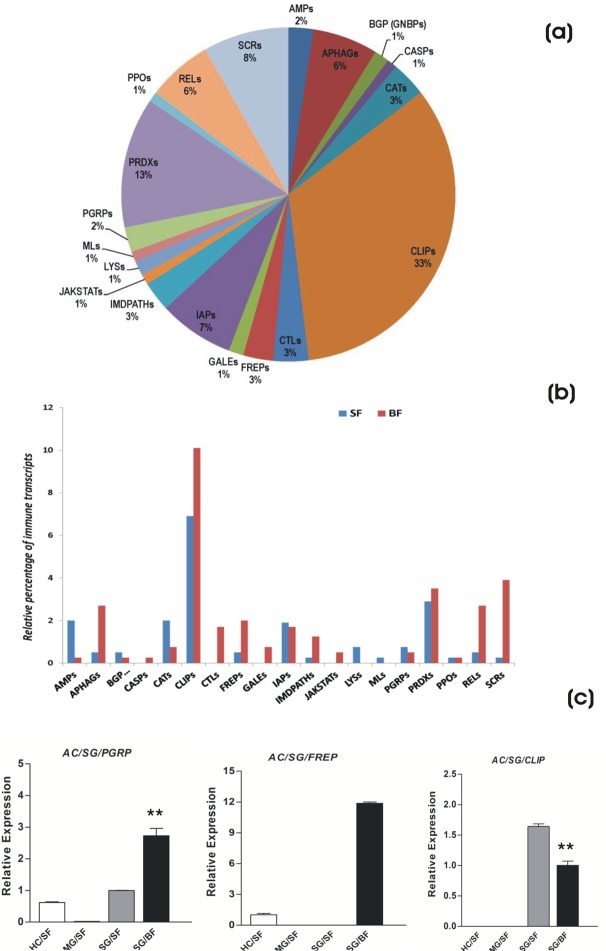
Fig. 2.
Molecular characterization of mosquito salivary immunome. (A) Molecular catalog of putative salivary immune transcripts predicted from the salivary gland transcriptome. (B) Change in the relative percentage of immune transcripts in response to differential feeding. (C) Tissue specific and differential regulation of the selected immune transcripts in response to blood feeding (*P≤0.05; **P≤0.001); HC, Hemocyte; MG, midgut; SG, salivary gland; SF, sugar fed; BF, blood fed. Error bar represents standard deviation from three biological replicates.

