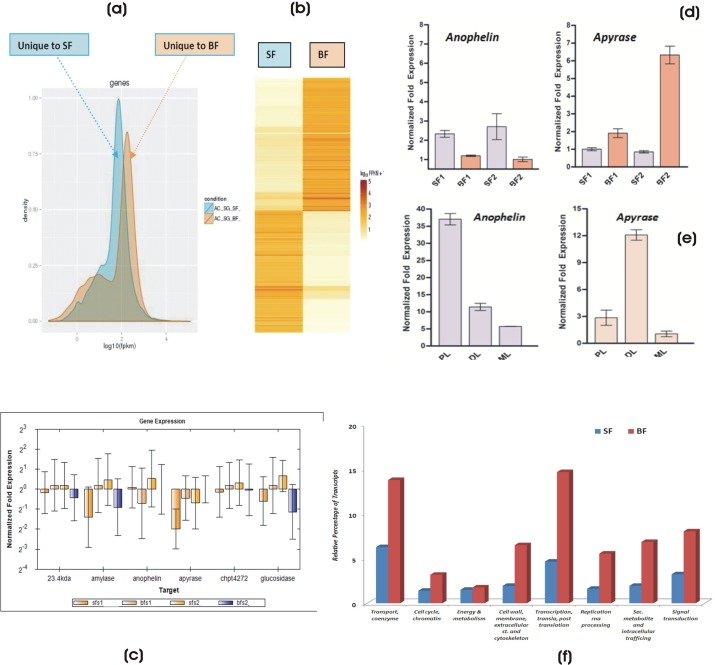
Fig. 7.
Salivary gene expression switching in response to dual feeding. (A) Read Density plot of the transcritome comparison showing unique contigs abundance restricted to feeding specific conditions of sugar feeding (blue) and blood feeding (orange). This analysis showed restricted expression of 1195 contigs to sugar feeding (12%) and 1021 contigs (10%) to blood feeding. See also supplementary material Table S5. Overlapping regions demonstrate commonly expressed genes. (B) Heat-map showing the global profiling comparison and distinct pattern of common salivary gene showing significant (P≤0.05) differential regulation. Relative gene abundance is defined by log10 of the normalized read number followed by Z-score transformation to visualize the expression level. Yellow indicates lower expression and red indicates higher expression. At least 17% of the transcriptome shows significant differential regulation of gene expression (P≤0.05), resulting in the expression alteration of 1767 contigss (847 blood fed and 920 sugar fed). (C) Real-time PCR-based verification of salivary gene expression in response to meal switching from sugar-blood-sugar-blood. (D) Real-time PCR-based validation of Anophelin and Apyrase (P≤0.05) regulation in response to meal specific switching; (E) Lobes specific expression of salivary Anophelin and Apyrase genes in blood fed mosquitoes (PL, Proximal lobe; DL, Distal lobe; ML, Median lobe). (F) Feeding specific switching results in the alteration of the molecular architecture of salivary glands: GO-Term based classification of salivary contigs significantly altered in response to blood feeding. SF, Sugar Fed; BF, Blood Fed; SFS1/SF1, Sugar Fed Series1; BFS1/BF1, Blood Fed Series1; SFS2/SF2, Sugar Fed Series2; BFS2/BF2, Blood Fed Series2. Error bar represents standard deviation from three biological replicates.

