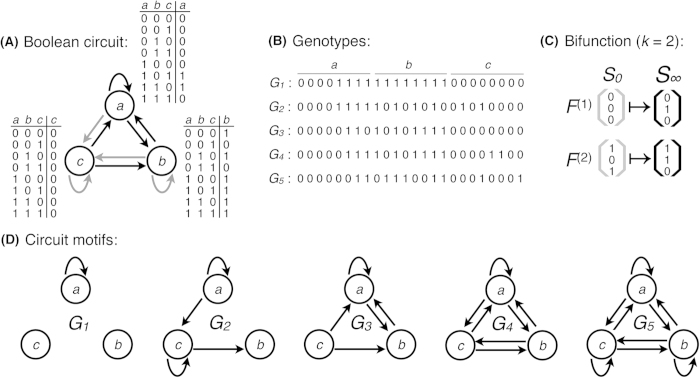
Figure 1. Schematic illustration of Boolean circuits.
(A) A Boolean circuit with N = 3 genes, which are labeled as open circles a, b, c. Gene expression states are binary, such that genes are either on (1) or off (0). A directed edge a → b connects two genes if the expression state of b is dependent upon that of a (black arrows). Such dependencies are captured in the lookup table associated with each gene, which deterministically maps the 2N possible expression states of N genes to an output expression state. These mappings may render some edges inactive (gray arrows). For example, the lookup table associated with gene b encodes the logical statement “a or not c”, which is independent of gene b. The autoregulatory interaction b → b is therefore inactive, as indicated by the gray arrow. (B) Five circuit genotypes Gi, each represented as a vector of length L = N × 2N = 24. Each genotype is constructed by concatenating the rightmost columns of the lookup tables of the circuit’s constituent genes. For example, the circuit shown in (A) is represented by the genotype G3, which — along with the circuits represented by the other four genotypes G1, G2, G4, G5 — has the bifunction shown in (C) i.e.,  ,
,  . These circuits have other k-functions as well. For example, the circuit encoded by genotype G3 has a total of 12 distinct bifunctions, because six initial states result in the equilibrium state 〈0, 1, 0〉 and two initial states result in the equilibrium state 〈1, 1, 0〉. (D) The circuit motifs that correspond to the five genotypes in (B) illustrating how a circuit’s genotype determines its structure. Note how the inactive edges (gray arrows) in the circuit shown in (A) are not present in the motif that corresponds to genotype G3. The five motifs increase in complexity — measured as their number of edges13 — from left to right.

