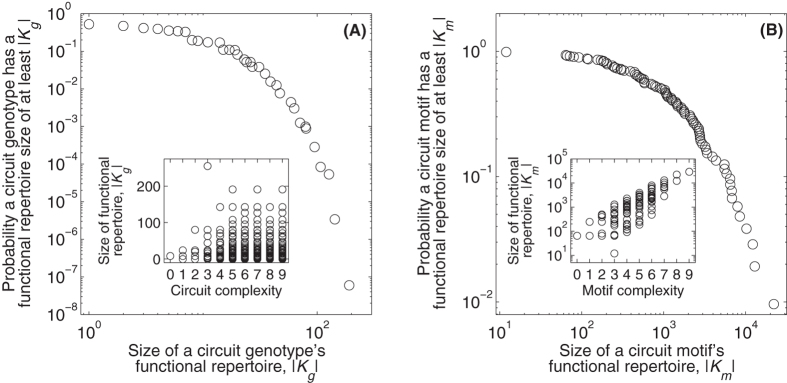
Figure 2. All circuit motifs have more than one k-function.

Each data point shows the probability that a circuit (A) genotype or (B) motif has a functional repertoire size of at least |Kg| or |Km|, respectively. The insets show the functional repertoire size in relation to the motif complexity, measured as the number of edges in the motif13, for (A) individual circuits and (B) all circuits with a given motif. Note the logarithmic scale of the x- and y-axes in the main panels and of the y-axis in the inset of (B).
