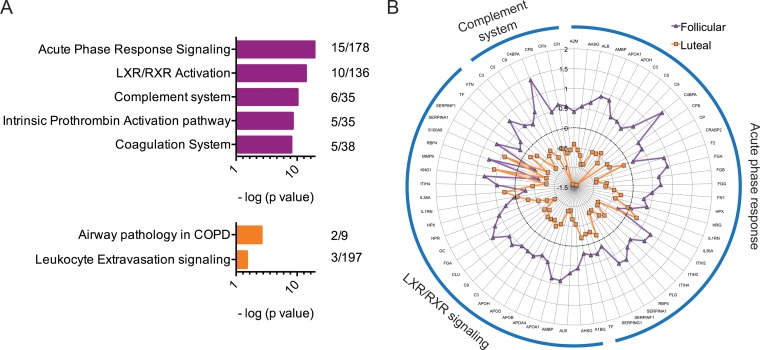
FIG 2.
The major canonical pathways associated with differentially abundant proteins observed in the follicular and luteal phase. (A) The top two branches identified by hierarchical clustering were further analyzed using IPA pathway software. The major canonical pathways associated with branch 1 (magenta; top: follicular overabundant proteins) and branch 2 (orange; bottom: luteal overabundant proteins) are shown in decreasing order by significance value (P < 0.05). Numbers adjacent to charts (right side) indicate numbers of proteins overexpressed out of the total number of factors involved in this pathway as characterized by the IPA knowledgebase. A right-tailed Fisher's exact test (Benjamini-Hochberg corrected; horizontal axis represents −log10 P value) was used to assess the association between each protein appearing in the data set and a known canonical pathway. Only the top pathways (and those with a −log10 P value of 2.0 and at least 2 proteins/pathway) are shown for vertical sizing. (B) Spider plot illustrating the expression patterns of the top three associated pathways. The average expression profile of all proteins identified in the mass spectrometry data set belonging to these three pathways is shown. Each concentric circle represents the average log2-fold change of the specific protein for each menstrual phase (follicular phase, magenta; luteal phase, orange). The black dotted circle represents mean expression across both phases. Overexpression of these three pathways is shown in the follicular phase compared to the luteal phase.

