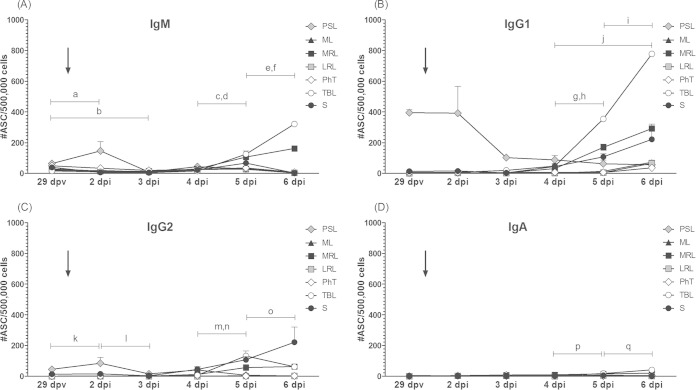
FIG 5.
Effect of the oronasal infection on the time course of FMDV-specific ASC in different lymphoid tissues from FMD-vaccinated cattle. Each panel presents the time progression of the mean anti-FMDV ASC counts for each particular isotype. Tissues and results are expressed as described in the legend to Fig. 3. Arrows indicate the oronasal infection time point. Selected significant differences in mean FMDV-specific ASC numbers/5 × 105 total MNC are represented in each graph as letters in lowercase. (A) a, TBL and MRL levels at 4 dpi were lower than those at 5 dpi (P < 0.001); b, S at 4 dpi < 5 dpi (P < 0.05); c, TBL and S at 5 dpi < 6 dpi (P < 0.001); d, MRL at 5 dpi < 6 dpi (P < 0.01). (B) e, TBL at 4 dpi < 5 dpi (P < 0.001); f, MRL at 4 dpi < 5 dpi (P < 0.05); g, TBL at 5 dpi < 6 dpi (P < 0.001); h, S at 4 dpi < 6 dpi (P < 0.01). (C) i, TBL at 4 dpi < 5 dpi (P < 0.001); j, MRL at 4 dpi < 5 dpi (P < 0.01); k, TBL at 5 dpi < 6 dpi (P < 0.001). (D) l, TBL at 4 dpi < 5 dpi (P < 0.01); m, TBL at 5 dpi < 6 dpi (P < 0.001).

