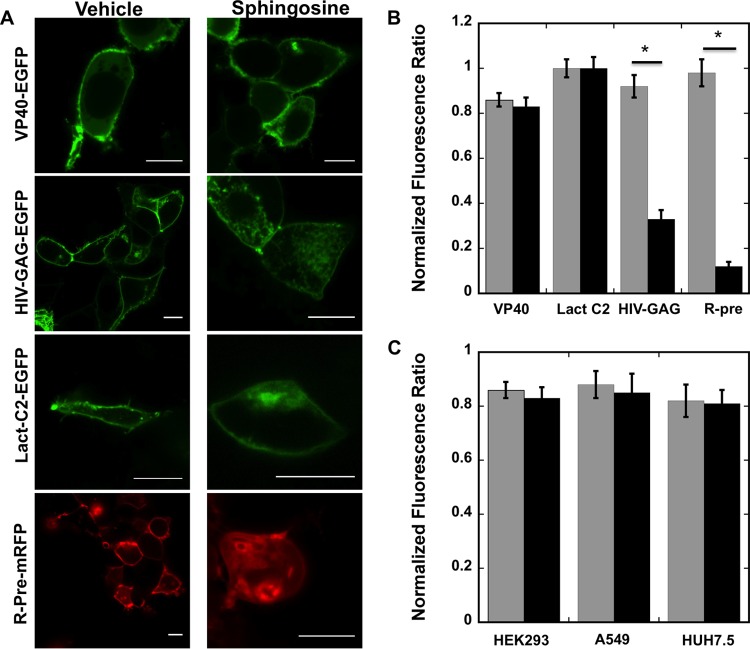
FIG 1.
Cellular imaging and distribution change with and without sphingosine treatment. (A) HEK293 cells expressing fluorescent fusion constructs of VP40, HIV-1 gag, Lact C2, or Rpre are shown after 1 h of treatment with vehicle (dimethyl sulfoxide [DMSO]) or 75 μM sphingosine. Bars, 10 μm. (B) HEK293 cells displaying detectable PM localization were quantified for the respective constructs following treatment with vehicle (gray bars) or 75 μM sphingosine (black bars). Three independent experiments were performed to determine the standard deviation (SD) for each measurement. *, P < 0.002. (C) HEK293, A549, or HUH7.5 cells displaying detectable plasma membrane localization were quantified with vehicle (gray bars) or 75 μM sphingosine (black bars). Three independent experiments were performed to determine the SD for each measurement.

