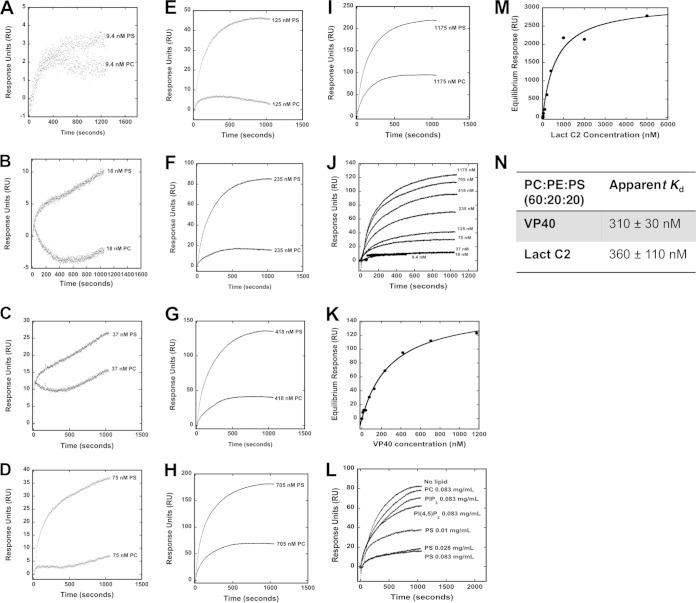
FIG 3.
SPR binding measurements of VP40 and Lact C2 with PS-containing vesicles. (A to I) Different concentrations of VP40 were injected into the Biacore X instrument, where flow cell 1 contained POPC:POPE (80:20) vesicles and flow cell 2 contained POPC:POPE:POPS (60:20:20). A flow rate of 5 μl/min was used for each injection. Flow cell 1 and flow cell 2 response unit (RU) values before VP40 injections were normalized to zero to present VP40 binding sensorgrams as shown. (J) Increasing concentrations (9.4 to 1,175 nM) of VP40 were assessed for binding to POPC:POPE:POPS (60:20:20) vesicles to determine the saturation response at each concentration to determine the apparent Kd. POPC:POPE (80:20) vesicles were used on a different flow channel for the control and subtracted to yield the respective curves (as derived from panels A to I). (K) The saturation response values determined from the data in panel J were plotted against the VP40 concentration to determine the apparent Kd value for PS-containing vesicles. (L) A SPR competition assay indicates that PS-containing vesicles but not PC-, PI(4,5)P2-, or PI(3,4,5)P3-containing vesicles preincubated with VP40 are able to compete for VP40 binding to a sensor surface coated with PS-containing vesicles. (M) The saturation response values determined for Lact C2 at increasing protein concentrations were plotted to determine the apparent Kd value for PS-containing vesicles. (N) Apparent Kd values determined for VP40 and Lact C2 binding to POPS-containing vesicles. n = 3 for VP40 and n = 4 for Lact C2 to determine the standard deviation (SD).

