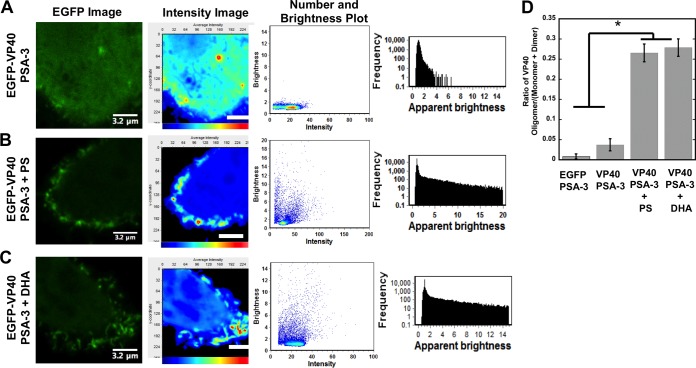
FIG 5.
Plasma membrane PS content regulates VP40 plasma membrane oligomerization. (A to C) VP40 oligomerization was assessed using confocal microscopy with N&B analysis in PSA-3 cells without supplementation (A), PSA-3 cells supplemented with PS (B), or PSA-3 cells supplemented with DHA (C). The EGFP image acquired is shown in the first column; the cellular average-intensity map (second column; scale bars are 3.2 μm) demonstrates the lack of EGFP-VP40 plasma membrane signal in PSA-3 cells and lack of enriched intensity characteristic of oligomerization. The second column of each panel shows a brightness-versus-intensity plot demonstrating the lack of VP40 oligomerization in PSA-3 cells. A frequency-versus-apparent-brightness plot (third column of each) demonstrates significant oligomerization of VP40 at or near the PM of PSA-3 cells upon PS supplementation. n = 4 independent experiments for each condition. y-coordinate, pixels. (D) Histogram plot of the VP40 oligomer/VP40 (monomer-plus-dimer) ratio to demonstrate the reduction in VP40 oligomerization in PSA-3 cells without supplementation compared to PSA-3 cells supplemented with PS or DHA. n = 4 independent experiments. One-way analysis of variance (ANOVA) was used to calculate the SEM and P values. *, P < 0.001.

