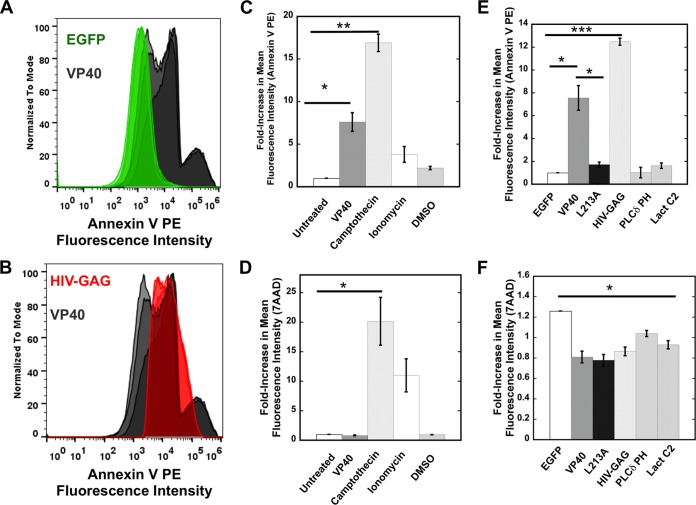
FIG 6.
Flow cytometry analysis of PS exposure. (A) HEK293 cells expressing EGFP or EGFP-VP40 were stained with annexin V PE according to the protocol detailed in Materials and Methods. The fluorescence intensity was normalized to the mode; data represent the results of independent experiments performed in triplicate. (B) HEK293 cells expressing EGFP–HIV-1 gag or EGFP-VP40 were stained with annexin V PE according to the protocol detailed in Materials and Methods. Note that the VP40 signals shown in panels A and B are the same to facilitate comparisons. (C) Annexin V staining was performed for HEK293 cells with or without VP40 expression. The median value of fluorescent intensity was measured for each sample to calculate the fold increase in mean fluorescence intensity for each sample normalized to untreated HEK293 cells. (D) 7-AAD staining was used to determine cell viability under the conditions indicated in panel A and to determine the median value of fluorescent intensity for each sample as described for panel A. This was used to calculate the fold increase in mean fluorescence intensity for each sample normalized to untreated HEK293 cells. (E) Annexin V staining, performed as described for panel A, was used to compare HEK293 cells expressing EGFP-VP40, EGFP, HIV-1 gag, and other fluorescent constructs. Note that the VP40 signals shown in panels C and E are the same to facilitate comparisons. (F) 7-AAD staining, performed as described for panel B, was used to determine the viability of HEK293 cells expressing EGFP-VP40, EGFP, HIV-1 gag, and other fluorescent constructs. Note that the VP40 signals shown in panels D and F are the same to facilitate comparisons. n = 3 for each condition; results were used to determine the SEM. *, P < 0.05; **, P < 0.01; ***, P < 0.001.

