FIG 7.
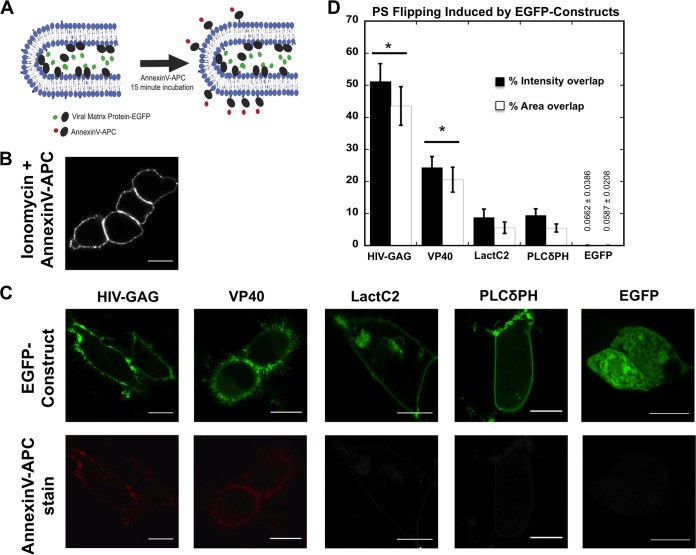
Imaging of PS exposure on live cells. (A) Cartoon representation of PS exposure imaging experiment where annexin V-APC was bound to extracellular PS exposed on a virus-like particle induced by an EGFP-viral matrix protein transfected into HEK293 cells. (B) Representative cells treated with ionomycin as directed by the manufacturer and with annexin V-APC stain in 1× annexin V binding buffer for 15 to 20 min. (C) Representative images of HEK293 cells transfected for 18 to 24 h with HIV-1 gag-EGFP, VP40-WT-EGFP, Lact C2-EGFP, PLCδPH-EGFP, and EGFP. Transfected cells were treated with annexin V-APC stain in 1× annexin V binding buffer for 15 to 20 min. All scale bars are 10 μM. (D) Quantification of PS exposure detected by annexin V-APC stain with EGFP constructs. A total of 25 to 40 cells per construct were imaged for each experiment, and four or more independent experiments were performed. Percent intensity and percent area overlap of annexin V-APC and EGFP at the plasma membrane were determined in MATLAB for each cell (see Materials and Methods). The results are displayed ± SEM, and significant (P < 0.05) increases in PS exposure from controls Lact C2, PLCδPH, and EGFP are marked with a star (*).

