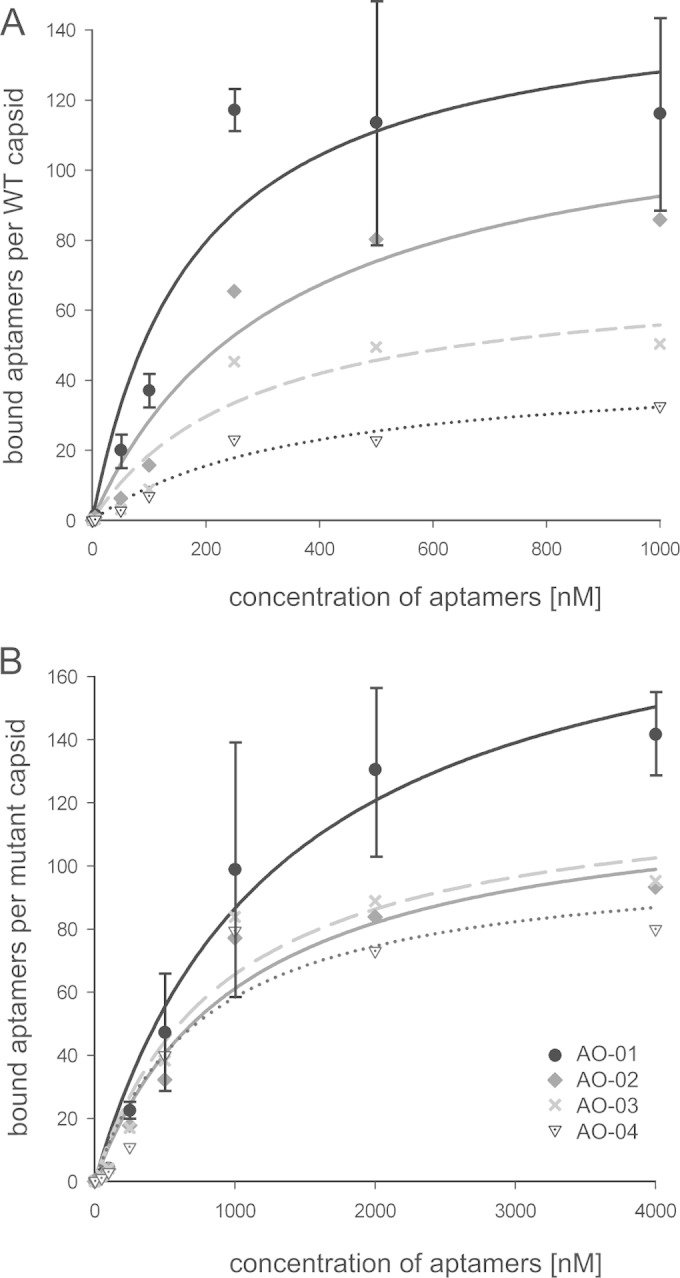
FIG 3.

Determination of Kd values for aptamer binding to WT and mutant capsids. Capsids at a constant concentration of 1 nM were mixed with five different concentrations of the four most abundant aptamers, AO-01 to AO-04. Capsid-aptamer complexes were separated, and bound aptamers were quantified. (A) The dissociation constants of aptamer binding to WT capsid and the abundance of aptamers as shown in Table 2 are negatively correlated. A saturation of AO-01 binding was reached with 120 aptamers per capsid. (B) Binding to I126A mutant capsids. The standard deviation (n = 3) is shown only for aptamer AO-01. The standard deviations for the other aptamers were in the same range (not shown). Designation of the symbols as shown in panel B applies also to panel A.
