FIG 1.
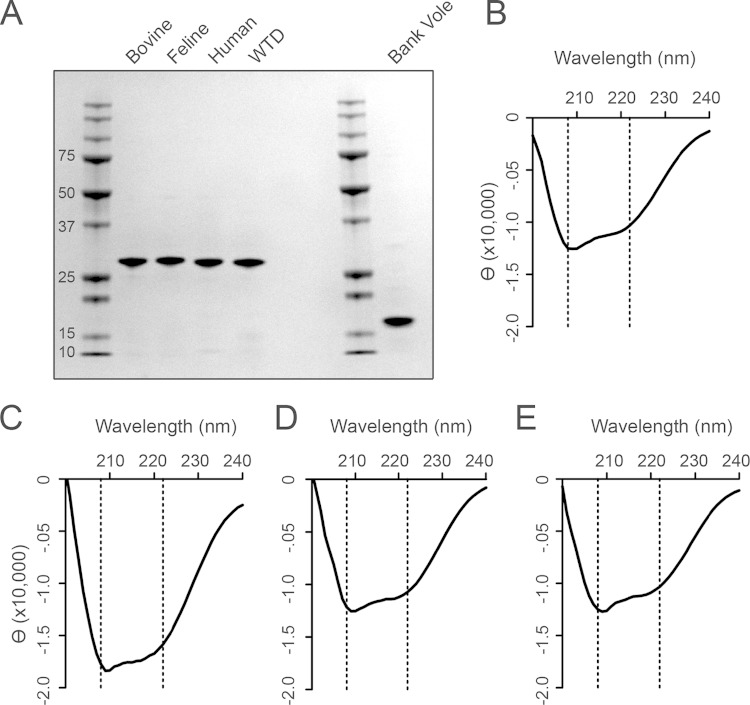
rPrP substrates are of comparable quality. (A) Coomassie blue visualization of 1.5 μg rPrP substrate indicates the purity of each rPrP. Bands represent, from left to right, ladder, bovine (amino acids 23 to 231), feline (aa 23 to 231), human M129 (aa 23 to 231), and white-tailed deer (aa 23 to 231) rPrP, ladder, and bank vole (aa 90 to 231) rPrP. (B) CD spectrum for bovine rPrP. (C) CD spectrum for feline rPrP. (D) CD spectrum for human M129 rPrP. (E) CD spectrum for white-tailed deer rPrP. The dotted lines indicate the anticipated minima for α-helical structure (B to F).

