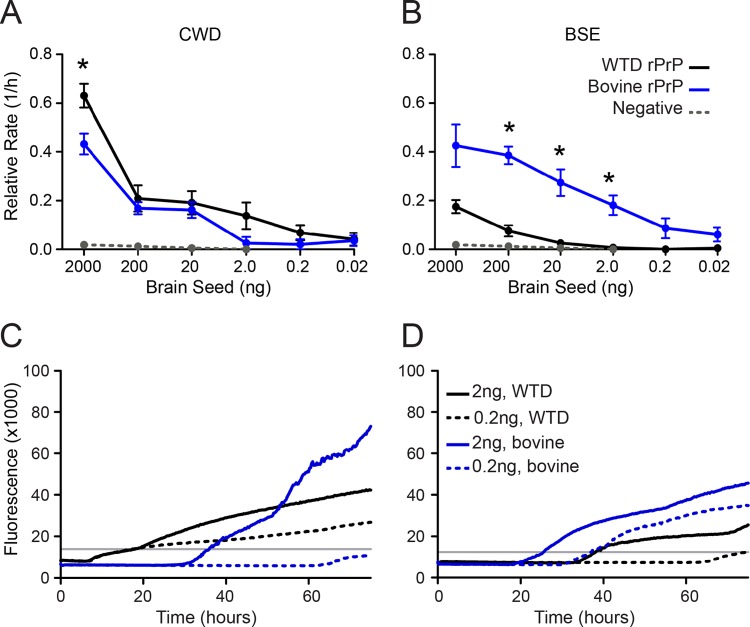
FIG 3.
Preference for intraspecies conversion by BSE and CWD prions is recapitulated in RT-QuIC. (A) CWD was seeded into white-tailed deer rPrP (black line) or bovine rPrP (blue line). (B) BSE is seeded into white-tailed deer (WTD) rPrP (black line) or bovine rPrP (blue line). Each point represents the relative rate of amyloid conversion for each seed concentration (in nanograms), and the error bars represent SEM. The rate of spontaneous amyloid conversion is designated by the dotted gray line in panels A and B. Significant differences between substrates were tested by the MWU test (*, P < 0.05). (C and D) Each line represents the average ThT trace for 6 replicates of 3 dilutions of each seed-substrate combination, and the gray line indicates the threshold for determination of the lag phase.

