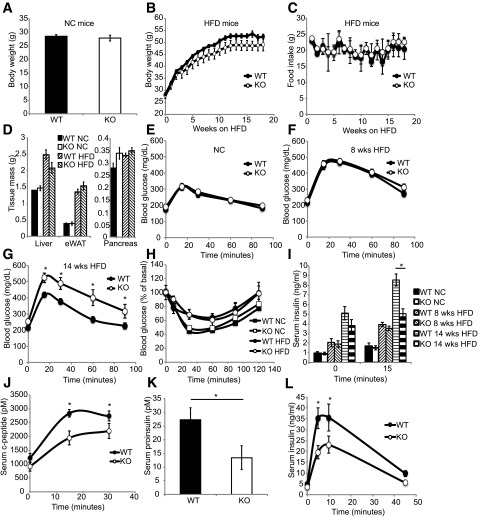
Figure 2.
GPR43 KO mice exhibit impaired glucose tolerance and insulin secretion. A: Body weight of NC diet–fed WT and KO mice, n = 10 per group. B: Body weight of HFD-fed WT and KO mice. WT mice, n = 9; KO mice, n = 7. Data are reported as the mean ± SEM. C: Food intake of HFD-fed WT and KO mice. WT mice, n = 4; KO mice, n = 4. D: Tissue weight of WT and KO mice fed an NC diet and an HFD. Data are reported as the mean ± SEM, n = 7–10. Intraperitoneal GTT (1 g/kg) in mice fed an NC diet (E; mean ± SEM, n = 10 per group), an 8-week HFD (F), and a 14-week HFD (G; mean ± SEM; WT, n = 9; KO, n = 7). H: Insulin tolerance test in mice fed an NC diet and a 15-week HFD. Data are reported as the mean ± SEM, n = 7–10. I: Plasma insulin concentrations during intraperitoneal GTT in mice fed an NC diet, an 8-week HFD, or a 14-week HFD. Data are reported as the mean ± SEM, n = 7 per group. Serum C-peptide (J) and proinsulin (K) levels in mice fed a 14-week HFD during intraperitoneal GTT. Data are reported as the mean ± SEM, n = 7 per group. L: Serum insulin levels of mice fed a 14-week HFD during arginine tolerance test. Data are reported as the mean ± SEM, n = 6–7 per group. *P < 0.05. eWAT, epididymal white adipose tissue.

