Figure 6.
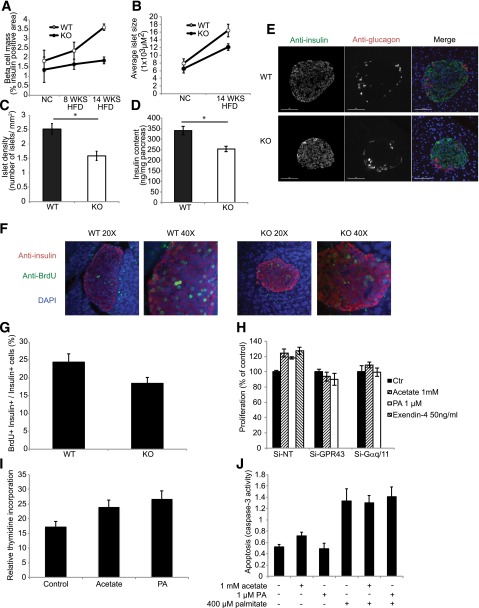
GPR43 regulates β-cell proliferation and mass. A: β-cell mass, measured as the percentage of the insulin-immunopositive area in pancreatic sections from WT and KO mice fed an NC diet, an 8-week HFD, and a 14-week HFD. B: Average islet size, determined by immunofluorescence, in pancreatic sections from WT and KO mice fed an NC diet and an HFD. C: Islet density, measured as the number of islets per square millimeter of pancreas area in HFD-fed WT and KO mice. D: Insulin content of HFD-fed WT and KO pancreata. Data are reported as the mean ± SEM. *P < 0.05, WT vs. KO. E: Immunohistochemistry analysis of the islet architecture of HFD-fed WT and KO mice. Anti-insulin is shown in green, and anti-glucagon is shown in red. F: Pancreatic sections stained for anti-insulin are shown in red, for anti-BrdU are shown in green, and for DAPI are shown in blue. G: Proliferation of β-cells, quantified as the number of nuclei from BrdU+ Ins+ cells, divided by the number of nuclei from Ins+ cells, multiplied by 100. H: Proliferation of Min6 cells depleted of GPR43 or Gαq/11 by siRNA, in the presence of 1 mmol/L acetate, 1 μmol/L PA, or 50 ng/mL exendin-4. I: Thymidine incorporation into isolated islets from WT mice in the presence of acetate or PA for 48 h, normalized to total protein content. J: Palmitate (400 μmol/L) induced apoptosis of Min6 cells, in the presence of 1 mmol/L acetate or 1 μmol/L PA. Data are reported as the mean ± SEM of three independent experiments. *P < 0.05, treatment vs. control. Ctr, control.

