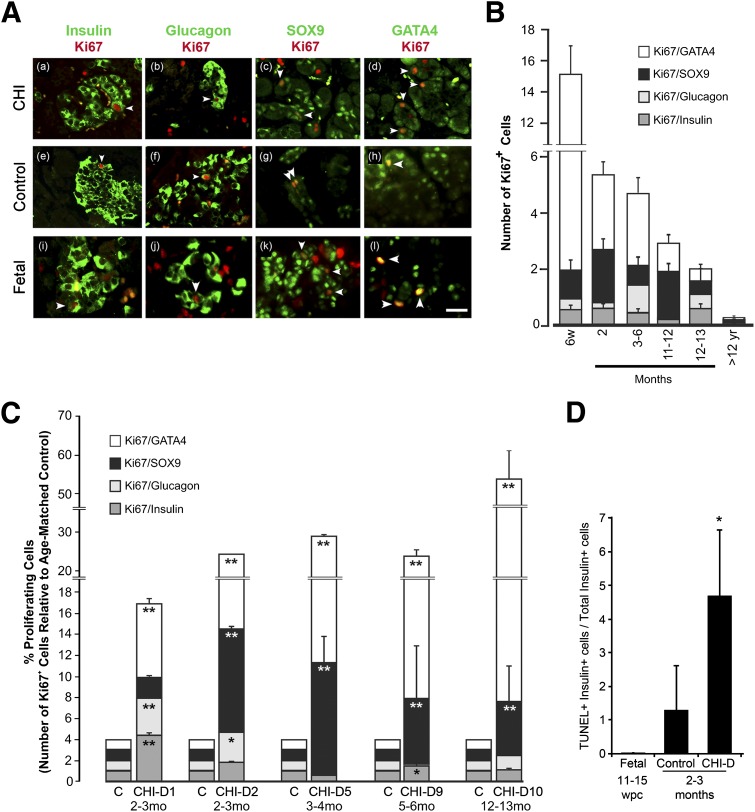
Figure 3.
Increased proliferation in all pancreatic cell lineages in CHI-D tissue. A: Dual immunofluorescence of markers for endocrine cells (β-cells, insulin; α-cells, glucagon) and nonendocrine cells (duct cells, SOX9; acinar cells, GATA4) (green) in the pancreas with Ki67 (red) for CHI-D pancreas, postnatal control tissue, and an example of fetal tissue at 14 wpc. Arrows show examples of costained cells. Scale bar = 20 μm in all panels. B: Total counts (±SEM) for Ki67+ cells dual-stained for the markers of different pancreatic lineages in human control pancreas. Total Ki67 count was correlated inversely with age (r2 = −0.929; P < 0.01). w, weeks; yr, years. C: Fold increase (±SEM) in proliferation for each cell lineage (as defined by the markers in A) for each CHI-D sample compared with its age-matched control (C). Each bar stacks the fold increments for each cell lineage. mo, months. D: Relative counts (±SEM) for TUNEL-positive/insulin-positive cells expressed as a percentage of the total insulin-positive cells for fetal and CHI-D samples and their age-matched postnatal controls. Statistical analysis performed using Mann-Whitney U test. *P < 0.05, **P < 0.01.

