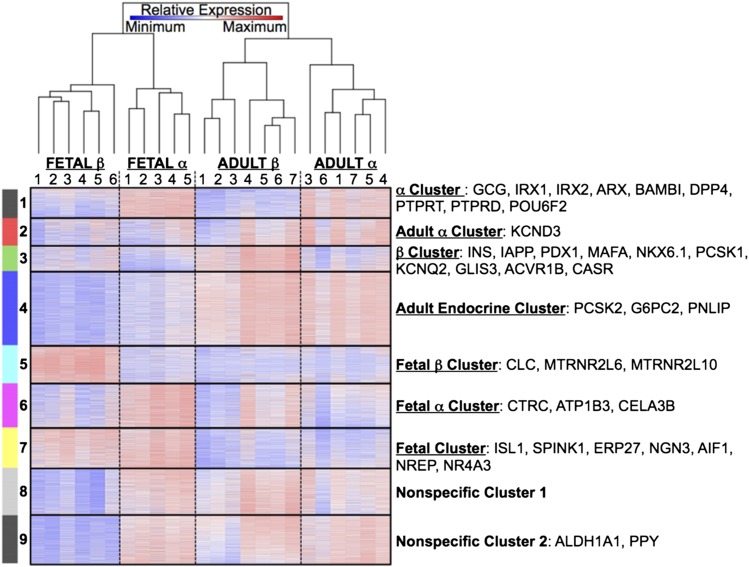
Figure 3.
The α- and β-cell gene expression patterns: heat map analysis. The cluster and heat map diagram shows the relative gene expression (blue represents minimal expression; white shows neutral expression; red indicates high gene expression) for sorted fetal human β-cells (n = 6; INS+), adult human β-cells (n = 7; INS+), adult human α-cells (n = 6; GCG+), and fetal human α-cells (n = 5; GCG+) separated by population. The sample dendrogram (columns) was calculated using hierarchical clustering, while the genes (rows) were clustered using the k-means algorithm. The specific genes listed to the right of each cluster demonstrate high relative gene expression in the cluster-specific samples compared with expression levels in all other samples.

