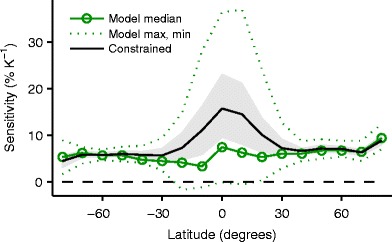
Fig 2.

Sensitivity of the 99.9th percentile of daily precipitation to global-mean surface temperature for climate change under the RCP8.5 scenario in CMIP5 global climate-model simulations. Shown are the multimodel median (green line with circles) and the full model range (dotted lines). Also shown are sensitivities inferred by constraining the model sensitivities using observations of tropical variability (black line) with a 90 % confidence interval obtained by bootstrapping as in [58] (gray shading)
