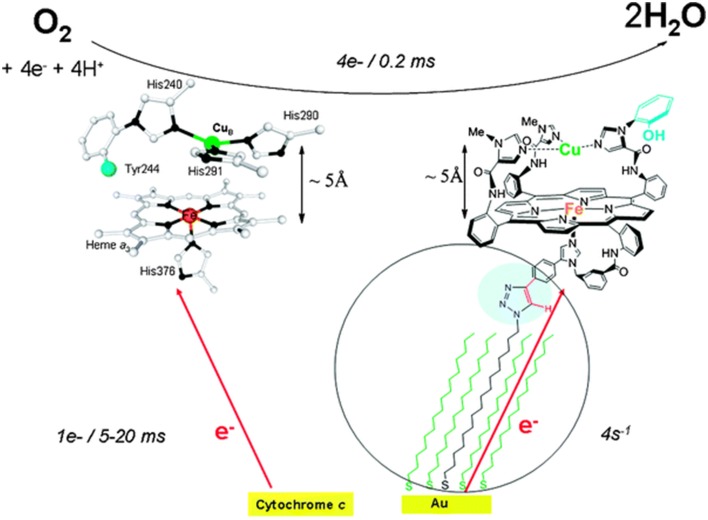
Figure 1.
Cytochrome c Oxidase heme a3/CuB active site (left), and Model (right). Top: the 4e reduction of O2; bottom: biological electron transfer rates from cyt. C (left), and biomimetic rates from the electrode (right). Reproduced with permission from Decreau et al. (2010).

