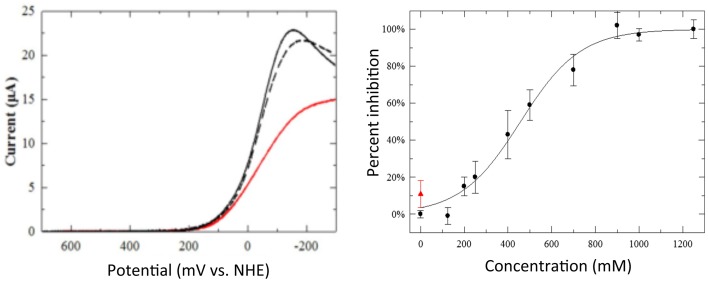
Figure 14.
Inhibition by heterocycles. Left: linear sweep voltammograms showing the model electrocatalytic O2 reduction (solid black line), its inhibition by a 1-mM solution of tetrazole (TZ, red line), and the recovery of its catalyst after removing the solution of TZ (dotted black line). Thirty-four percent inhibition of peak current by 1-mM solutions of TZ. Right: percent inhibition of mitochondrial inhibition vs. concentration of TZ (black circles). Upon separating TZ from mitochondria by centrifugation and resuspending in buffer restores its respiration (red triangle). Reproduced with permission from Barile et al. (2012) and Collman et al. (2011).

