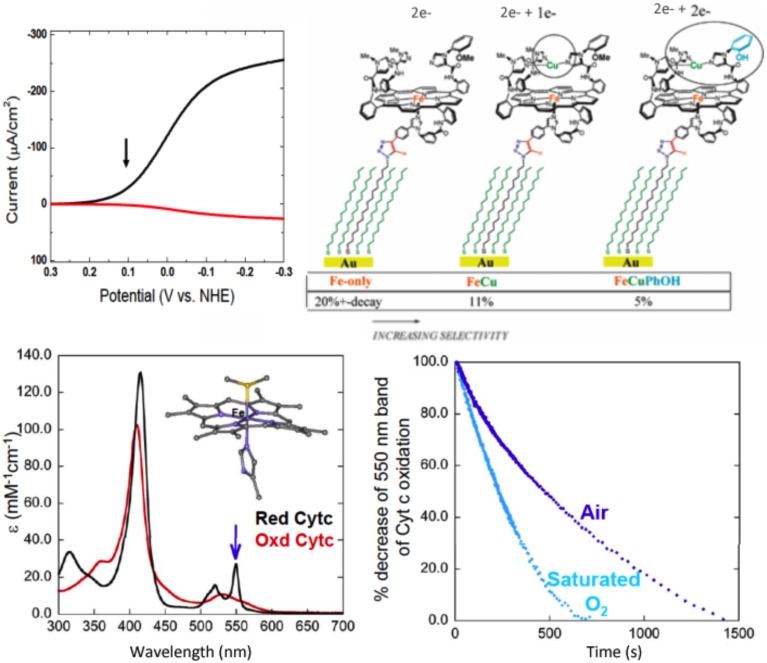
Figure 6.
Continuous reduction of O2. Top: Model 1 is immobilized, the electron source is an electrode. Electrocatalytic O2 Reduction on slow SAM: Top left: Rotating ring-disk voltammograms of slow SAM modified with model 1 (arrow indicate at which potential PROS were measured). Top right: percentage of PROS detected on slow SAM modified with models bearing a 2e−, 3e−, and 4e− pool, respectively. Bottom: model 1 is in solution, the electron source is cytochrome c. Bottom left: Kinetic traces showing a decrease of reduced cyt. C in the presence of 2% of 1 in aqueous buffer: acetonitrile mixture. Insert: absorption spectra of reduced and oxidized cyt c. Bottom right: reduced 1 (blue) and 1-iron only (red) in the presence of O2. Insert: absorption spectra of reduced-1 (blue) and 1-iron only (red). Reproduced with permission from Collman et al. (2007b); Collman et al. (2009b) and Decreau et al. (2010).

