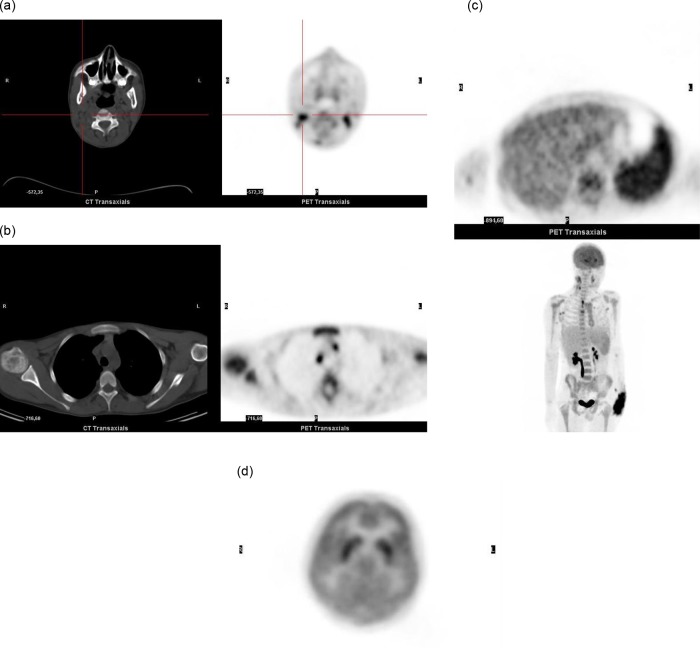
Figure 1.
(A) Axial positron emission tomography and CT images of the cervical region. (B) Axial positron emission tomography and CT images of the mediastinal region. (C) Axial positron emission tomography images corresponding to the spleen and liver and multiple intensity projection images. (D) Axial positron emission tomography images from the brain region to show subcortical nuclei.

