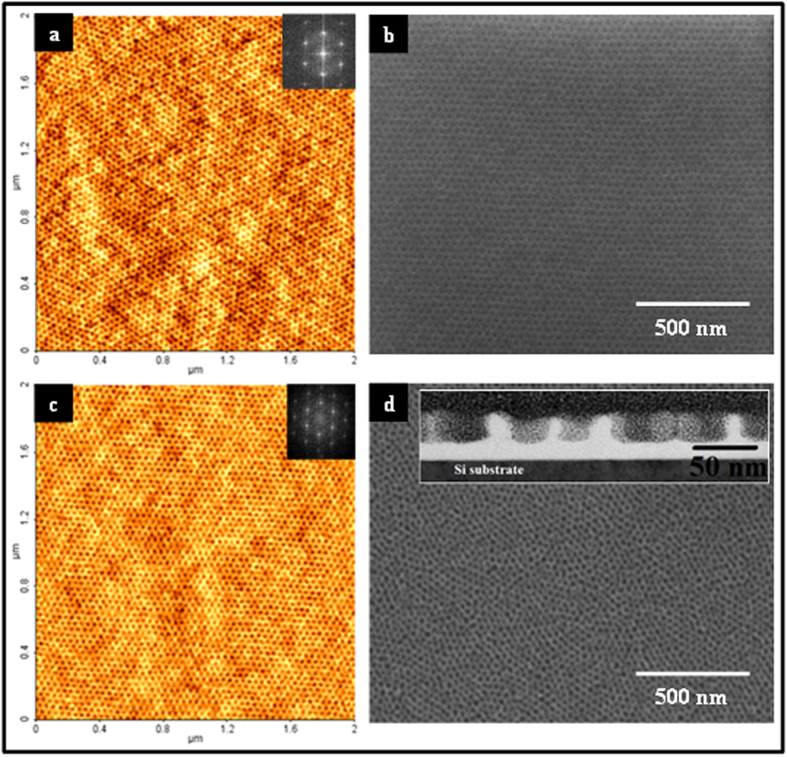
Figure 2. AFM (a,c) and SEM images (b,d) of BCP template films.
ALW data shown in (a,b) whilst BHW data in (c,d). Insets of (a,c) show the FFT patterns of the corresponding images. (b,d) templates of ALW and BLW respectively after ethanol treatment. Inset of (d) cross-sectional TEM image of BLW after ethanol treatment.

