


Figure 2. Features of action potentials recorded at 1 Hz.
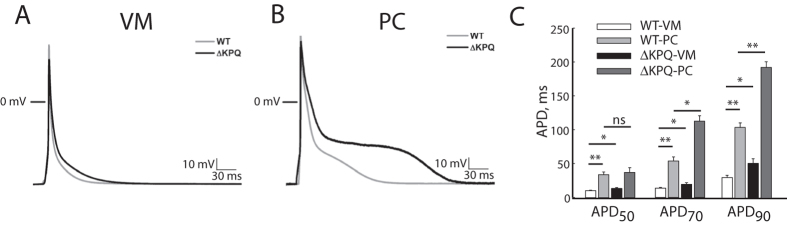
Panel (A) Representative VM action potentials. 0 mV represented by horizontal line; gray trace: WT, black trace: ΔKPQ. Panel (B) Representative PC action potentials. 0 mV represented by horizontal line; gray trace: WT, black trace: ΔKPQ. Panel (C) Bar graphs summarizing action potential duration measured at 50% of repolarization (APD50), 70% repolarization (APD70) and 90% repolarization (APD90). White bar: WT-VM, light gray bar: WT-PC, black bar: ΔKPQ-VM, dark gray bar: ΔKPQ-PC. *p < 0.05, **p < 0.01. WT-VM: N = 16, 6 animals; ΔKPQ-VM: N = 12, 5 animals; WT-PC: N = 16, 6 animals; ΔKPQ-PC: N = 20, 5 animals. APD: action potential duration.