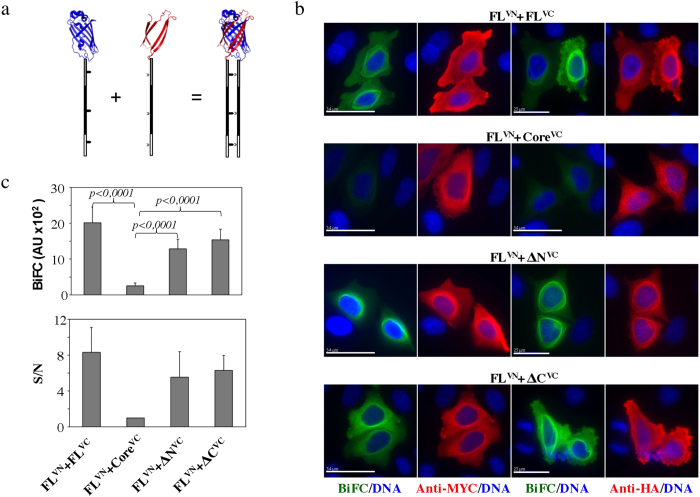
Figure 5. TPPP/p25-TPPP/p25 interactions in cells detected by BiFC.
(a) Schematic representation of the generation of fluorescence based on the complementation between the N- and C-terminal domains of Venus fluorescent protein fused to proteins capable of interacting with each other. (b) BiFC signal generation in cells that were co-transfected with the myc-tagged FL fused to VN155(I152L), indicated as FLVN and either HA-tagged FL- or ΔN-, ΔC- and core- fused to the VC155, indicated as FLVC or ΔNVC, or ΔCVC or coreVC, respectively. Co-expression of the two chimeras was confirmed by immunofluorescence microscopy using antibodies recognizing either the myc- or the HA- tags. (c) Fluorescence intensities of Venus-based BiFC assays in cells transfected as described in panel (b). Each bar represents the mean ± SD from three independent experiments (at least 30 BiFC-positive cells measured for each count). Data were compared using the Mann Whitney test (n = 100, 113, 110 and 95 for FLVN-FLVC, FLVN-coreVC, ΔNVN-coreVC and ΔCVN-coreVC, respectively). The signal to noise (S/N) ratio was estimated by dividing the fluorescence intensity from the positive interaction (FLVN-FLVC; FLVN-ΔNVC; FLVN-ΔCVC) by that from the negative interaction (FLVN-coreVC) (scale bars = 17 μm).

