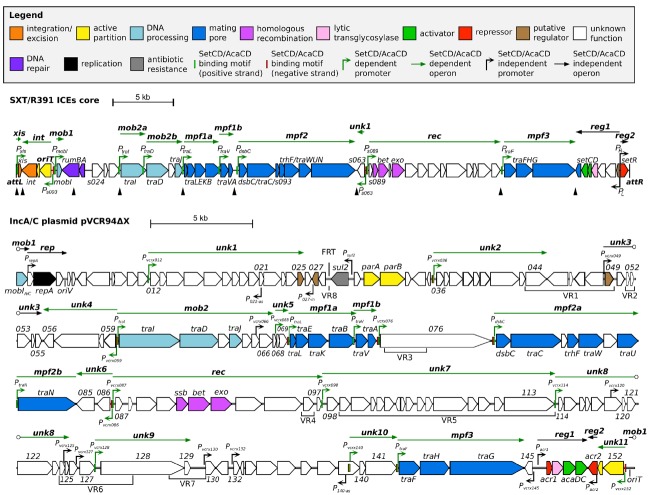
FIGURE 1.
Schematic representation of the genetic organization and transcriptional units of the conserved core of SXT/R391 ICEs (integrated in prfC) and pVCR94ΔX (circular map linearized at the start position of gene mobI) adapted from Poulin-Laprade et al. (2015) and Carraro et al. (2014a, 2015a). Genes are represented by arrows and color coded according to their function as indicated in the legend. For clarity, ORF names vcrxXXX were shortened as XXX for pVCR94ΔX. SetCD- and AcaCD-binding motifs located on positive and negative DNA strands are represented by light green and red narrow boxes, respectively. Operons are indicated by arrows positioned above represented genes. SetCD- and AcaCD-regulated promoters and operons are colored in green. Open circles mark operons interruptions generated by the map format. mob1-2, DNA processing; rep, replication; unk1-11, unknown; mpf1-3, mating pore formation; rec, recombination; reg1-2, regulation. P021–as and P140–as: vcrx021 and vcrx140 antisens promoters, respectively. P027–in: vcrx027 internal promoter. Black triangles show the position of variable cargo DNA in SRIs, while variable DNA regions inserted in the conserved core of ACPs are indicated below genes (VR1 to VR8). The origin of replication (oriV) and the origin of transfer (oriT) are indicated. The position of the FRT site resulting from the deletion of the antibiotic resistance gene cluster in pVCR94 is also shown.

