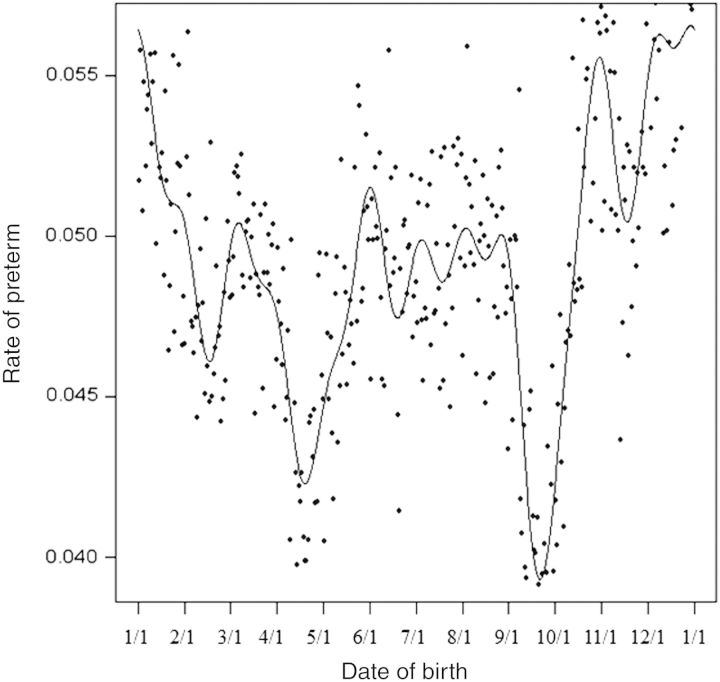
Figure 1.
The observed rate of preterm delivery shown by day of the year of birth for all 2 321 652 singleton births in the Norwegian Medical Birth Registry. The smooth curve is fitted based on including the first 12 harmonics, which are shown separately in Figure 2; that is, the smooth curve in Figure 1 is the sum of the 12 curves shown in Figure 2.

