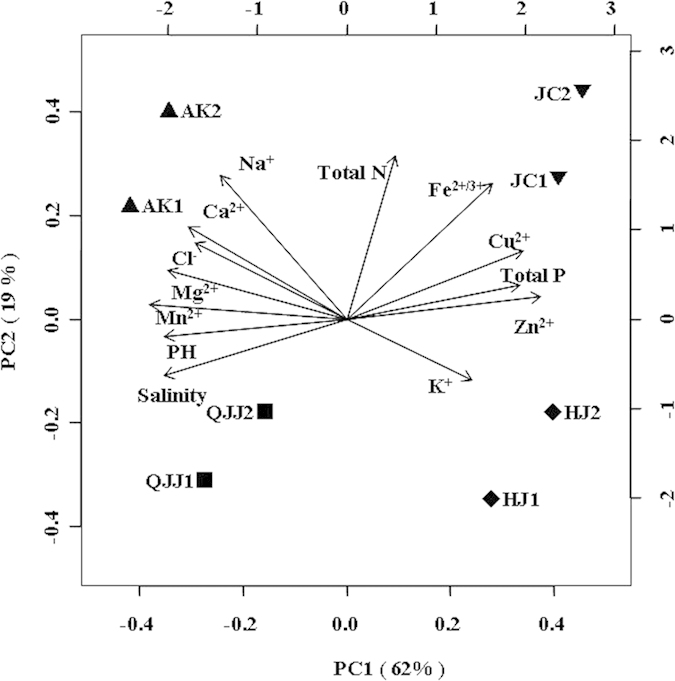
Figure 1.

(A) PCA map showing the 8 sampling sites and their correlation with trace elements. Note: pH, Cl–, Ca2+, Mg2+, K+, Na+, Fe2+, Mn2+, Cu2+, Zn2+, total N (nitrogen) and total P (phosphorus) were used to evaluate the influence of each variable. The longer the arrow, the greater the influence; the smaller the angle between two arrows, the closer their correlation. solid squares (■), upright (▲) and inverse (▼) triangles, and diamonds (♦) denote the Qijiaojing (QJJ), Aydingkol (AK), Jiangcheng (JC) and Heijing (HJ) sampling sites, respectively.
