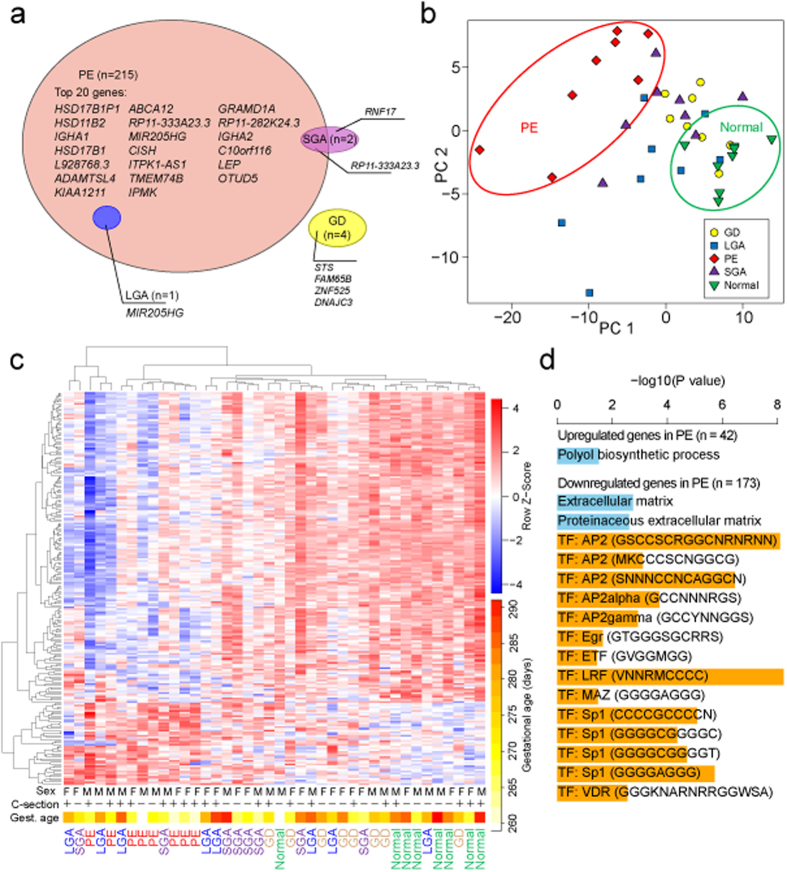
Figure 2. Differential gene expression in cases of preeclampsia (PE), gestational diabetes (GD), cases of small- and large-for-gestational-age newborns (SGA, LGA) compared to normal pregnancy (Normal) based on RNA-Seq profiling of 40 term placental samples (n = 8/group).
(a) Venn diagram showing differentially expressed genes in each pathology group supported by stringent statistical significance criteria (DESeq: FDR < 0.1 and DESeq2: FDR < 0.05). (b) Principal component analysis (PCA, the two first components are plotted) and (c) hierarchical clustering based on transformed read counts of 220 differentially expressed genes across pregnancy complications. The gene expression levels were subjected to variance stabilizing transformation in DESeq and standardized by subtracting the mean expression across all samples from its value for a given sample and then dividing by the standard deviation across all the samples. This scaled expression value, denoted as the row Z-score, is plotted in red-blue color scale with red indicating increased expression and blue indicating decreased expression. Hierarchical clustering of genes (rows) and samples (columns) was based on Pearson’s correlation. Hierarchical clustering trees are shown for the analyzed samples (top) and genes (left). For each sample are shown newborn sex (M, male; F, female), delivery by caesarean section (+/–) and gestational age at birth plotted in white-yellow-red color scale (white < 260, red > 290 gestational days). (d) Significantly enriched categories among the significantly differentially expressed genes in PE (n = 215) from gene set enrichment analysis in g:Profiler. Horizontal bars indicate significance. Blue bars represent GO terms, orange bars represent transcription factor binding sites.

