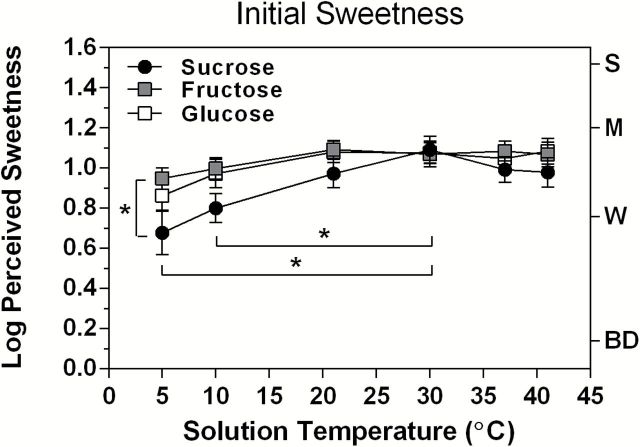
Figure 1.
Log10-mean perceived sweetness ratings as a function of solution temperature are shown for an initial 3-s exposure to the 3 saccharides tested in experiment 1. The vertical bar and asterisk next to the data for 5 °C indicate that sweetness was significantly lower for sucrose than for fructose at that temperature; horizontal bars and asterisks indicate significant differences between the sweetness of sucrose at both 5 and 10 °C relative to 30 °C, where mean sucrose sweetness was highest. Error bars represent standard errors of the means; letters on the right y axis refer to intensity descriptors on the gLMS: BD, barely detectable; W, weak; M, moderate; S, strong.

