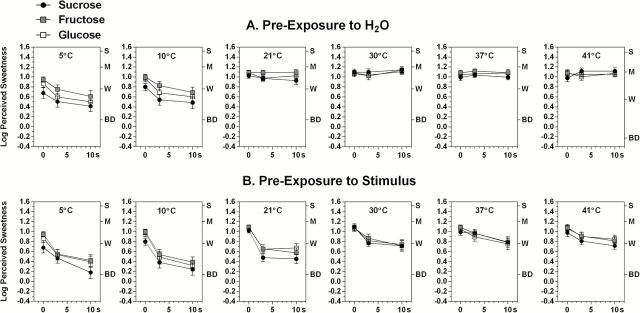
Figure 2.

Shown are log10-mean perceived sweetness ratings for 3-s exposures to each of the 3 saccharides after 0-, 3-, or 10-s pre-exposures to (A) deionized H2O or (B) the same taste stimulus at 6 different solution temperatures. Solution temperature was the same for pre- and post-exposures. Note that (A) shows the effect of solution temperature alone on suprathreshold sensitivity, whereas (B) shows the combined effects of solution temperature and adaptation. Error bars represent standard errors of the means; letters on the right y axis refer to intensity descriptors on the gLMS: BD, barely detectable; W, weak; M, moderate; S, strong.
