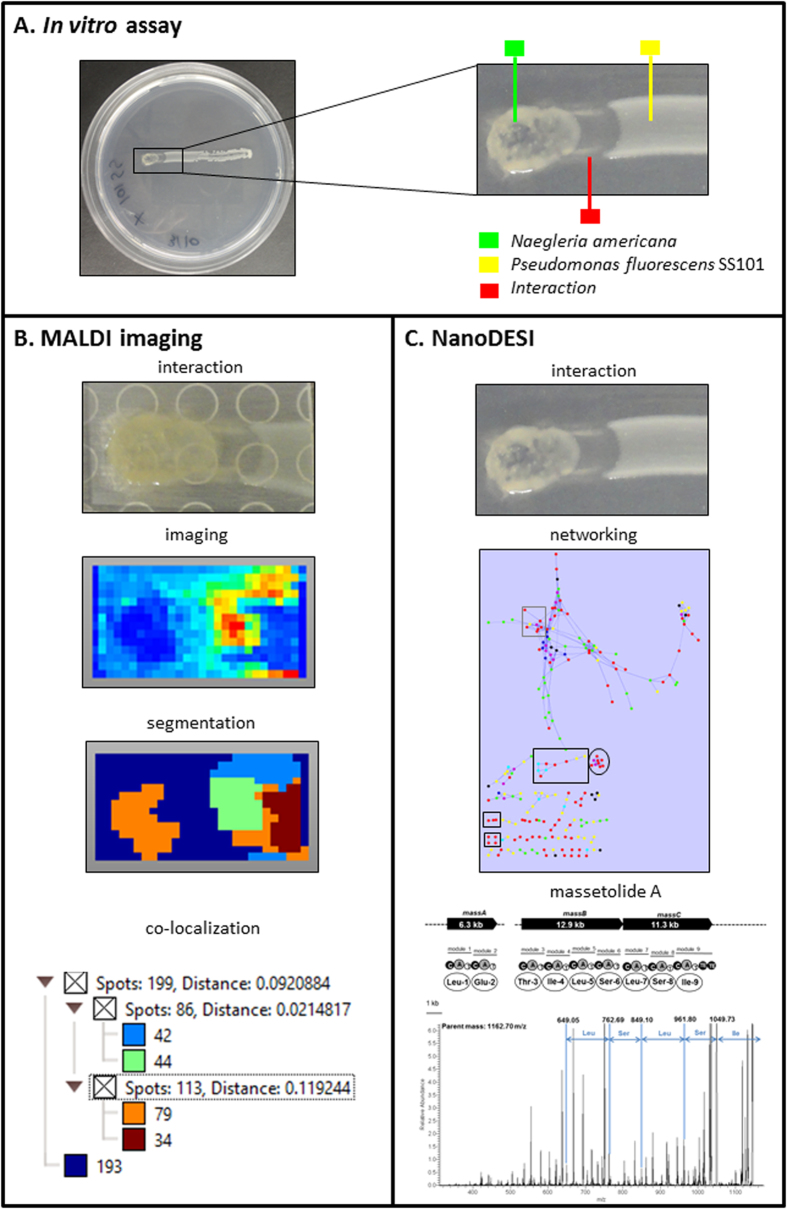
Figure 3.
(A) Experimental setup to study Pseudomonas-protozoa interactions by MALDI imaging mass spectrometry (IMS). The green box-line indicates the protozoan predator N. americana alone; the red box-line indicates the interface of P. fluorescens SS101-N. americana; the yellow box-line indicates P. fluorescens SS101 alone. (B) MALDI-IMS analysis of the Pseudomonas-protozoa interaction, including imaging of metabolite classes, spatial segmentation and co-localization of the MALDI IMS data. (C) MS/MS network analysis and annotation of ion clusters from the P. fluorescens SS101-N. americana interaction. Ion clusters in the black squares represent the lipopeptide massetolide A and its derivatives; the black circle represents the 325-477 m/z ion cluster; the grey square represents the 766-796 m/z ion cluster. MS/MS analysis further indicated that the parent ion with 1162.70 m/z detected in the P. fluorescens SS101- N. americana interaction is most likely massetolide A. Complete lists of the ion clusters detected in the network analysis are given in Tables S4, S5 and S6.

