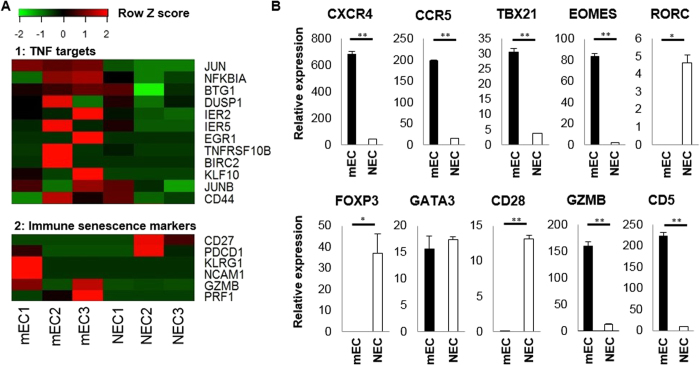
Figure 5. Gene expression profiles of synovium memory-mECs.
Three single-cell cDNA samples were randomly selected from both memory-mECs and memory-NECs in the synovium, and analyzed by single-cell RNA-Seq. (A) A heatmap of TNF target genes and immune senescent markers. The TNF targets genes were shown to be significantly up-regulated in memory-mECs by the gene set enrichment analysis (see details in the text and supplementary methods). (B) cDNAs of synovium memory-mECs and memory-NECs obtained by the single-cell analysis were mixed (2 pooled samples in total), and qPCR was performed. ACTB was used as an internal control gene. *p < 0.05, **p < 0.005.

