Figure 1.

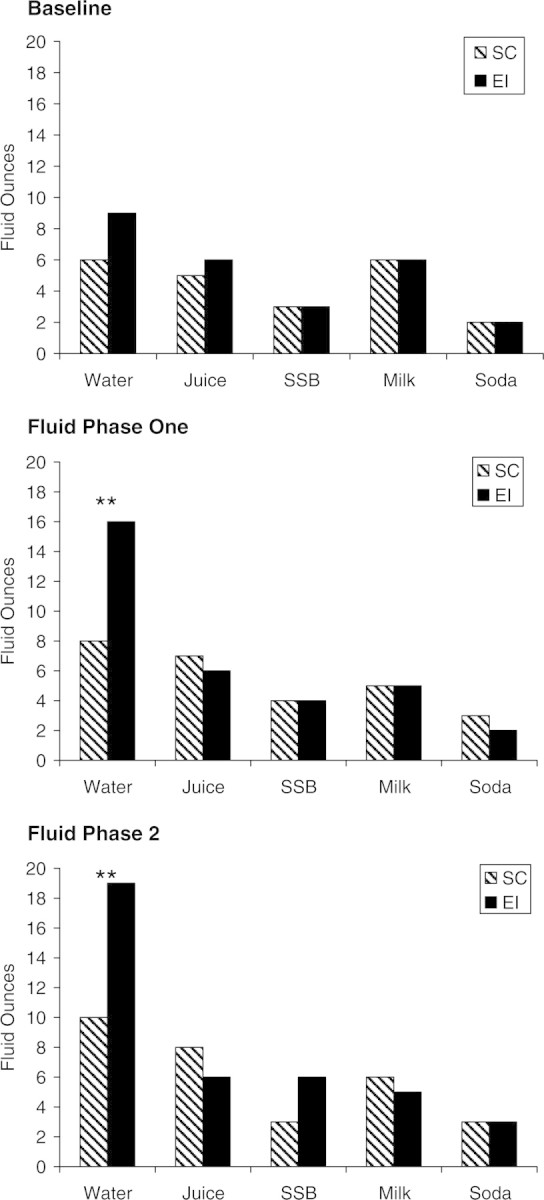
Between-group comparison of mean (model-based estimates) daily intake for all fluid types by fluid phase. **p ≤ .001. SSB, Sugar-sweetened beverage.

Between-group comparison of mean (model-based estimates) daily intake for all fluid types by fluid phase. **p ≤ .001. SSB, Sugar-sweetened beverage.