
Fig. 3.
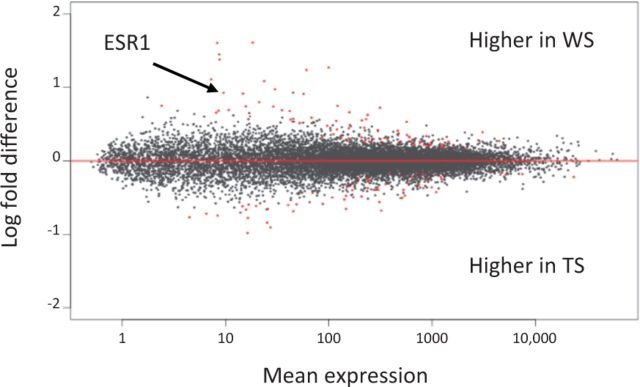
Analysis of RNA-seq data for all transcripts in the medial amygdala of 10 WS and 9 TS free-living males. Genes shown in red (see online version), which include ESR1, are differentially expressed.
Official websites use .gov
A
.gov website belongs to an official
government organization in the United States.
Secure .gov websites use HTTPS
A lock (
) or https:// means you've safely
connected to the .gov website. Share sensitive
information only on official, secure websites.
Analysis of RNA-seq data for all transcripts in the medial amygdala of 10 WS and 9 TS free-living males. Genes shown in red (see online version), which include ESR1, are differentially expressed.