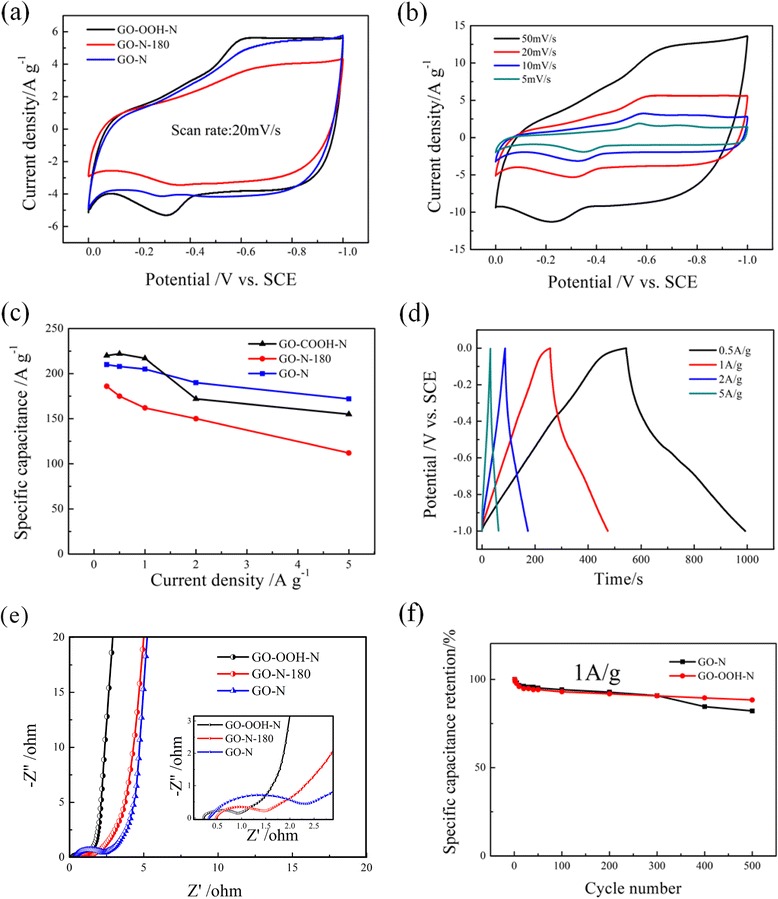
Fig. 6.

a CV curves of samples at 20 mV/s. b CV curves of GO-OOH-N at different scan rates. c Specific capacitance of samples at different current density. d Galvanostatic charge/discharge (GCD) curves of GO-OOH-N. e EIS spectrum of samples. f Cycling performance of GO-N and GO-OOH-N
