Fig. 2.

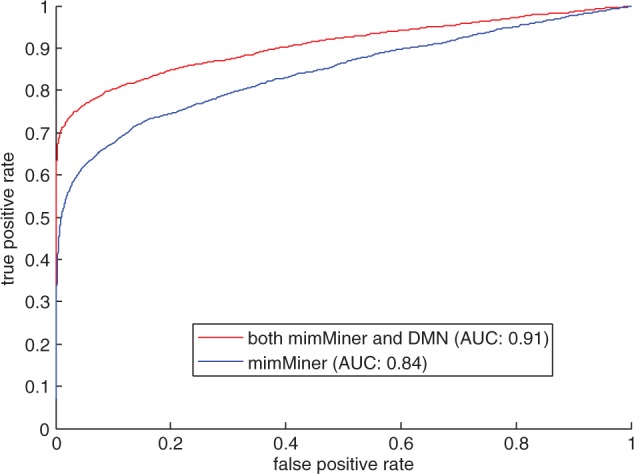
The ROC curves and AUCs for our method (red) and the baseline method (blue) in the leave-one-out cross-validation analysis

The ROC curves and AUCs for our method (red) and the baseline method (blue) in the leave-one-out cross-validation analysis