
Fig. 2.
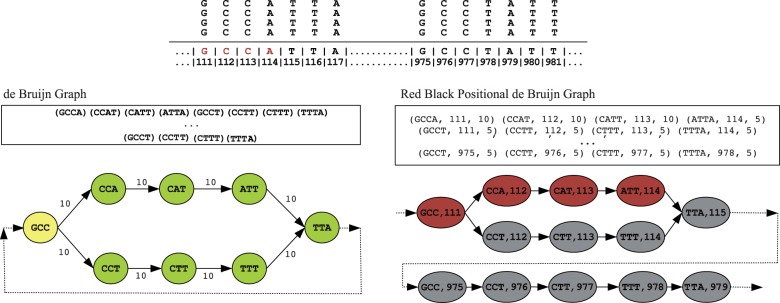
An example illustrating the red black positional de Bruijn graph (), the positional de Bruijn graph and the de Bruijn graph on a set of aligned reads, with their corresponding sets of k-mers and positional k-mers. There exists a region in the genome that extremely high coverage, which would suggest a possible misassembly error. Namely, the positional k-mers (GCCA, 111), (CCAT, 112) and (CATT, 113) have multiplicity 10, whereas all other positional k-mers have multiplicity 5. In the de Bruijn graph where the position is not taken into account, all k-mers have multiplicity of 10 and there is no evidence of a misassembled region. We note that in this example no vertex gluing operations occur but in more complex instances, vertex gluing will occur when equal k-mers align at adjacent positions