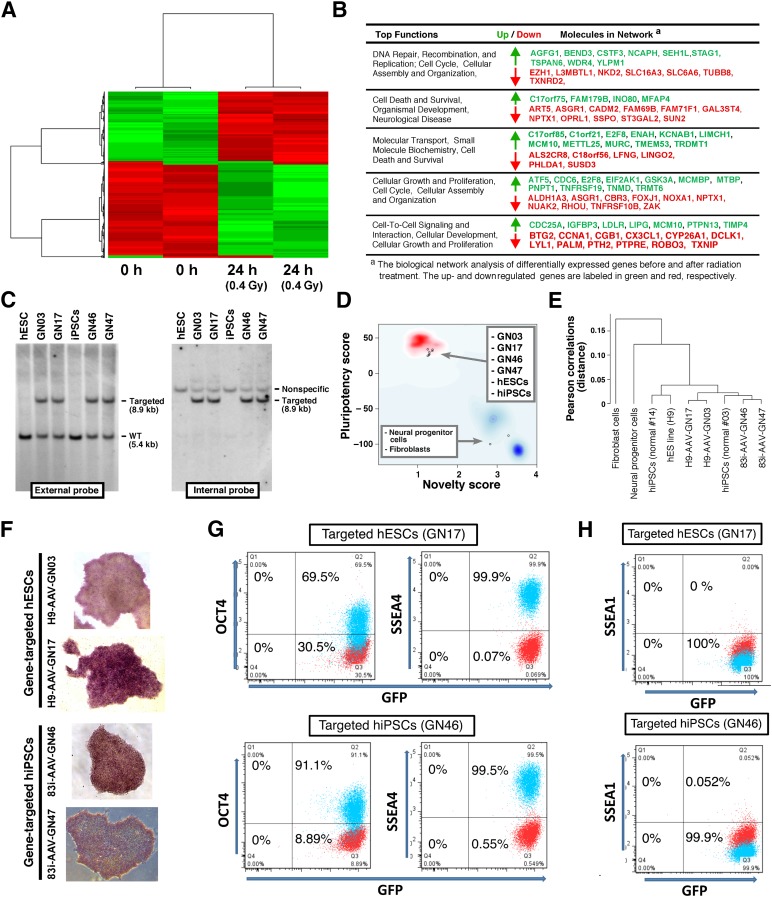
Figure 4.
Analyses of gene expression and pluripotency after 0.4-Gy γ-ray radiation. (A): Two-way hierarchical clustering analysis of the most variably expressed genes before and after treating hESCs with 0.4-Gy γ-ray radiation . The clustering of samples and genes is based on the Pearson correlation coefficient of the normalized expression of the 703 probes containing more than 0.85 standard deviation either side of the mean across all samples. Data were mean centered. Green and red illustrate relative over- and underexpression, respectively, of the genes. Relative distances between samples and genes are shown in dendrograms above and to the side of the heat map, respectively. The gene list is shown in supplemental online Table 1. (B): The biological network analysis by Ingenuity Pathway Analysis. (C): Southern blot analysis of gene-targeted iPSCs generated by 0.4-Gy radiation in the AAVS1 locus. Original hESC (H9 line) and hiPSC (83i) genomic DNA was included as a negative control. External and internal probes are shown in Figure 1D. (D): Gene expression profiles of four independent targeted clones were analyzed by PluriTest to evaluate pluripotency. Pluripotency and novelty scores of targeted lines are presented. These scores were compared with hESCs, hiPSCs, and differentiated cell samples (neural progenitor and fibroblast cells). (E): A correlation tree of each analyzed sample by PluriTest. (F): Alkaline phosphatase staining of each targeted line. (G): OCT4 and SSEA4 pluripotency gene expression analyzed by flow cytometry in targeted stable hESC (GN17) and hiPSC (GN46) clones. (H): SSEA1 expression analyzed by flow cytometry in targeted stable hESC (GN17) and hiPSC (GN46) clones. Abbreviations: GFP, green fluorescent protein; h, hours; hESC, human embryonic stem cell; hiPSC, human induced pluripotent stem cell; kb, kilobase pairs; Q, quartile; WT, wild type.

