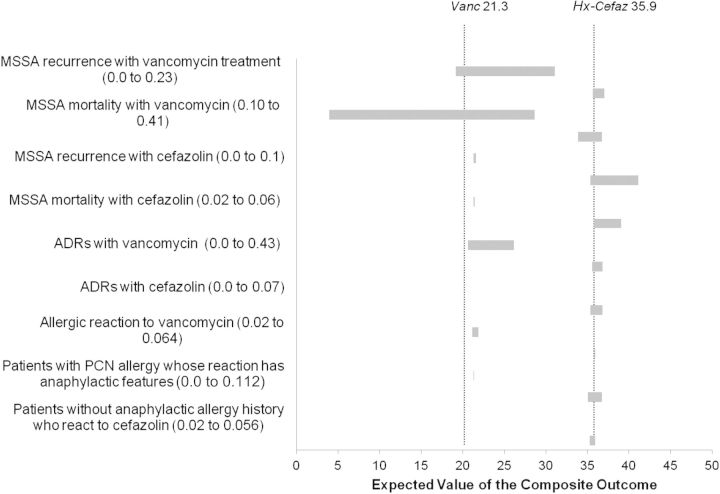
Figure 2.
One-way sensitivity analyses for the composite outcome for patients with methicillin-sensitive Staphylococcus aureus (MSSA) bacteremia and reported penicillin (PCN) allergy, comparing Vanc to Hx-Cefaz (see Figure 1 for decision tree). This tornado diagram summarizes the results of all influential 1-way sensitivity analyses on the composite outcome (cure, +50; recurrence of infection, −20; death, −50; major allergic reactions, −10; minor allergic reactions, −2; adverse drug reactions [ADRs], −6) with the variables examined within the probabilities described on the vertical axis. Each horizontal bar represents the range of expected values generated by varying the related variable across its plausible range, as indicated at opposite ends of each bar. A wide bar indicates that the associated variable has a large potential effect on the composite outcome. The vertical dotted lines represent the expected value of the composite outcome for Vanc (21.3) and Hx-Cefaz (35.9). Because there is no overlap between bars in Vanc and Hx-Cefaz, there is no plausible input parameter change that could result in the Vanc strategy having a higher composite outcome than the Hx-Cefaz strategy. Abbreviations: Hx-Cefaz, allergy history–guided treatment: if history excludes anaphylactic features, give cefazolin; Vanc, no allergy evaluation, give vancomycin.

