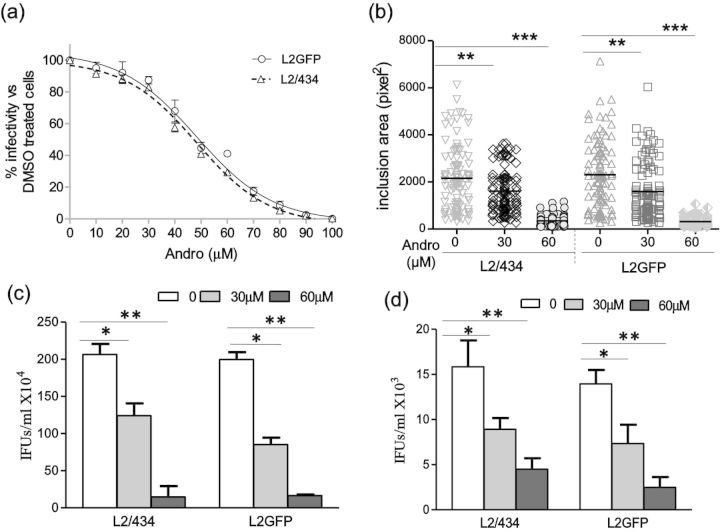
Figure 2.
Inhibitory effect of Andro on C. trachomatis growth. (a) Dose–response curves for C. trachomatis-infected HeLa 229 cells exposed to Andro. Cells infected with C. trachomatis L2/434 (Δ) or L2GFP (○) were fixed at 44 h pi and processed for IFA. The data represent the mean ± SEM from three separate experiments, in which quadruplicates were tested. (b) Changes in inclusion sizes induced by Andro. Infected cells were exposed to Andro at increasing concentrations of 0, 30 and 60 μM. One hundred inclusions were measured for each category from three separate experiments. The area data represent the mean ± SEM. The P-value was determined using one-way ANOVA with a Bonferroni test. (c) Determination of EB progeny yields by IFU assays with C. trachomatis-infected HeLa 229 cells. (d) Determinination of EB progeny yields by IFU assays with culture supernatants. Samples were collected at 36 h pi. Shown are representative results from three separate experiments, in which triplicates were tested. Data bars represent the mean ± standard deviation (SD). The P-value was determined using one-way ANOVA with a Bonferroni test. *P < 0.05, **P < 0.01 and **P < 0.001.

