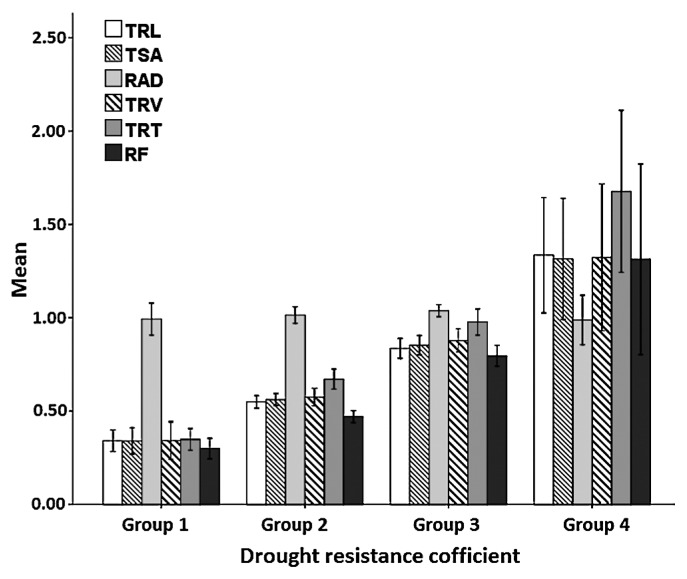
Fig. 4.
The mean values and standard deviations of drought resistance coefficient for 9 traits in three groups classified for drought tolerance. Groups 1, 2, 3 and 4 represent inbred lines identified with drought sensitivity, moderate sensitivity, moderate drought tolerance and high tolerance ability under drought stress. N = 7, 42, 45 and 9 for groups 1, 2, 3 and 4, respectively. Bars are the standard deviation. TRL: total root length; TSA: total root surface area; RAD: root average diameter; TRV: total root volume; TRT: total root tips; RF: root forks.

