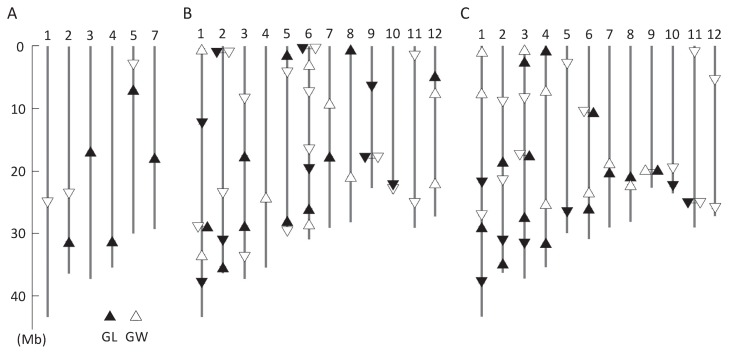
Fig. 2.
Chromosome locations of the QTLs for grain length and grain width detected in this study. (A) F2 population (Koshihikari × IR64), (B) IRK-BC4F2 population (see Fig. 1 for details), (C) KSI-BC4F2 (see Fig. 1 for details). Upward-pointing triangles (△, ▲) indicate that the IR64 alleles increase the parameter value, whereas downward-pointing triangles (▽, ▼) indicate that the IR64 alleles decrease the parameter value.

