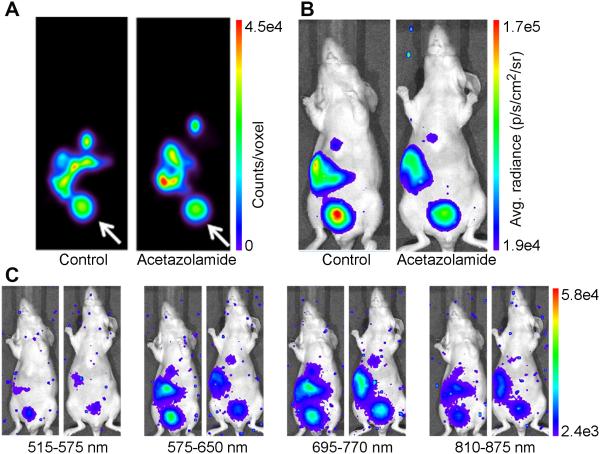
Figure 4. In vivo imaging of Cerenkov quenching.
Mice were treated with either saline or 160 mg/kg acetazolamide for 5 days prior to imaging with 18F-MFCP. (A) APET images of a single coronal slice 0.5 mm thick through the center of the mouse in control and acetazolamide-treated mice show 18F-MFCP accumulation in bladder (white arrow), gall bladder, liver, intestine. Optical images of the same mice were acquired using (B) open filter and (C) the four emission filters.

